░░░░░░░ WEEK 1 ░░░░░░░
Semester Break Plans & Scheduling
I had planned out a schedule during the semester break to ensure that I’m on track when I return to this
semester. Looking at the submissions timeline, the dissertation will be due during the first half of the
semester, while I have a little more time to prepare for my graduation project.
In order to finish my dissertation, my prototype has to be complete first before I can start writing and
documenting my findings. After some future projection, I found that I didn’t need to have a fully complete
prototype before completing the dissertation. I have ample time after Week 7 to deal with the bells and
whistles before the presentation on Week 16.
Previously, I also kept the number of thought experiments open, so I have the flexibility of constant
updates to my prototype and how I conduct my thought experiments until it yields negligible results.
However, that is no longer a realistic option. My new plan going forward is just to conduct 2 sessions,
putting in more effort to the preparation phase in order to gather as much resources for iteration as I
can.
I didn’t project a possibility of conducting any thought experiment sessions during the break due to how
busy it gets during that time of the year. So my extra time went towards keeping my dissertation up to
date with my progress, documenting my preparation phase and amending some of the comments I got from
Andreas in my Summative Feedback. Having read the dissertation again, I do agree that my literature review
was a little too long-winded, and removed most of the unnecessary writing, also moved some stuff around to
make it easier to read.
Going into the final semester, I feel rather confident in myself having resolved some pretty complex
issues I had in the first half of the year. Having took a hiatus on my part time work, I have a little
more time and headspace to deal with whatever problems that might come my way. My only concern now is how
I’m going to be presenting my graduation project (visually) during the graduation show, but I’m also sure
that the solution to that will unfold itself going into the next few weeks.
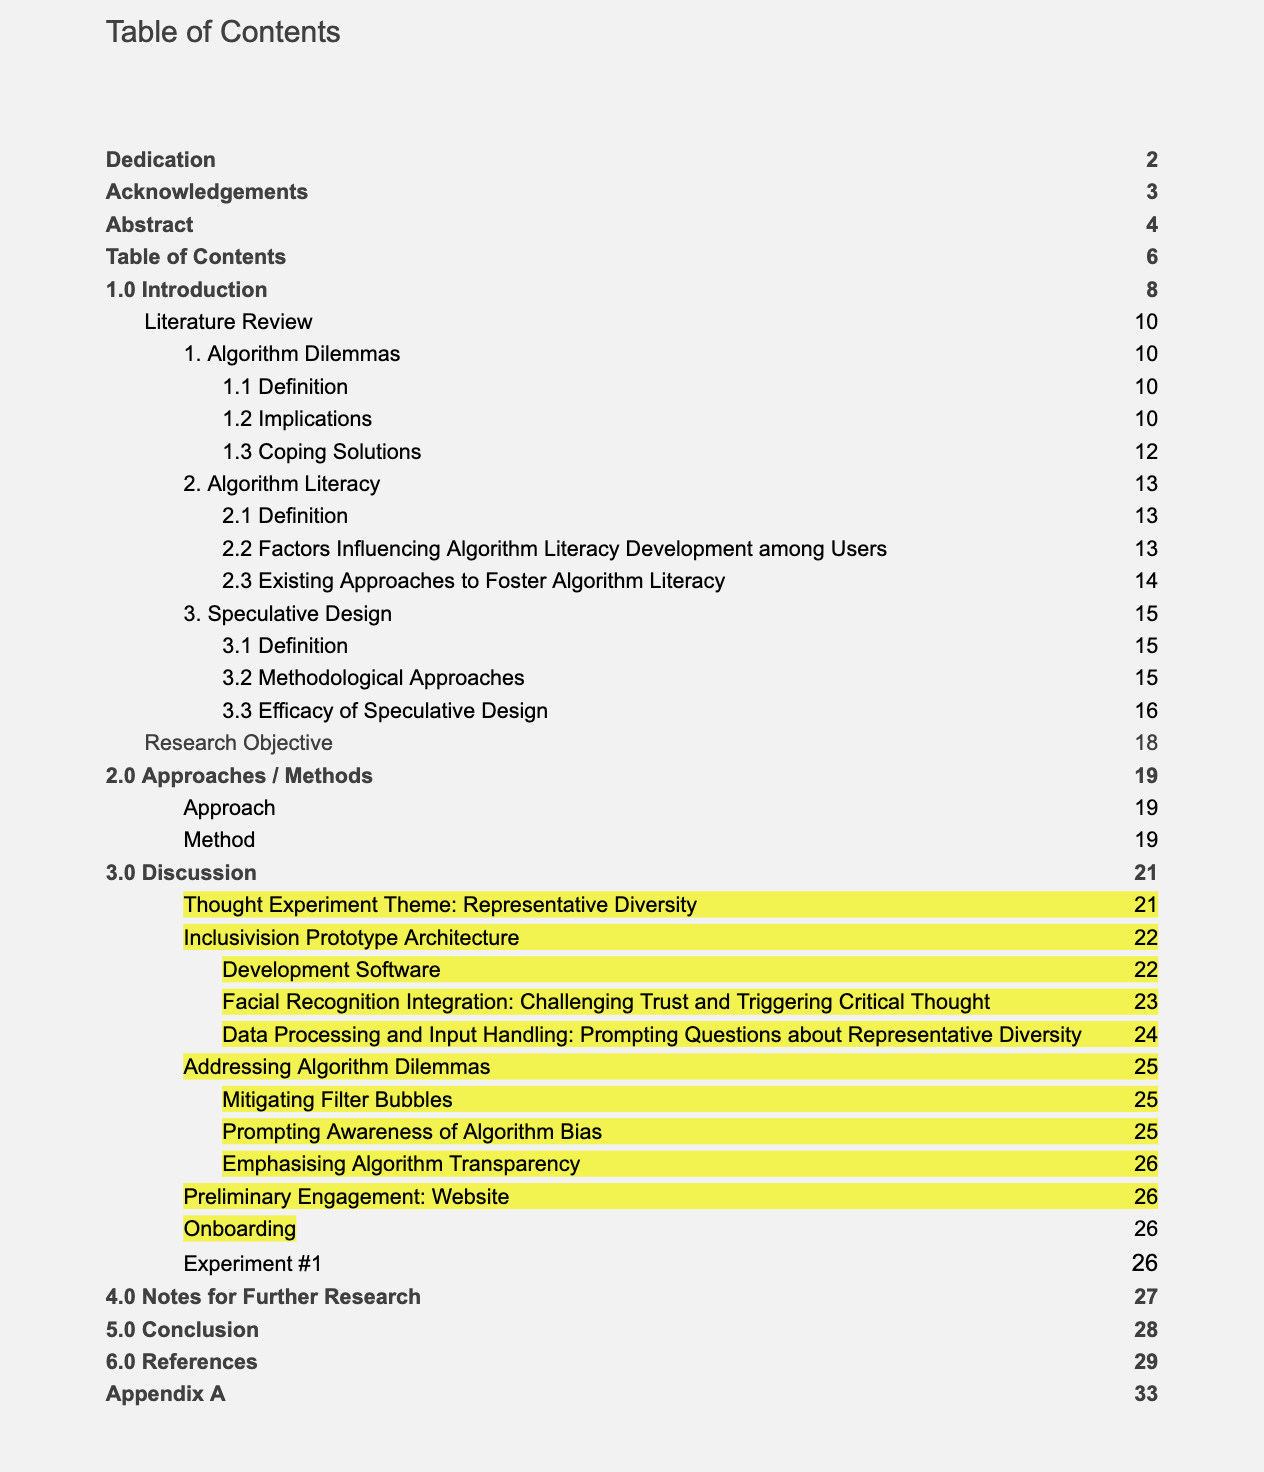
Highlighted: New Dissertation Sections
Prototype Back End
In architectural terms of the prototype, I would consider the components that require a CHOP channel value
as part of the back end design of the prototype. This is the section that I deem the most complex, due to
the math expressions and limitations of the software tools that can determine the functionality of my
prototype.
Having understand how I got familiar with this software throughout the past semester, I found that I
absorb knowledge not through following step by step tutorials, but the logic that goes into each
individual tool and how they come together. This works in my advantage as I can just scrub through video
sections, since I won’t be able to find follow-along tutorials for what I’m trying to achieve. Carrying
over my experience with p5js, I’ve also gotten quite accustomed to understanding the TouchDesigner tool
references on the derivative website, making it easier for me to select operators.
Replicating Cropped Faces
Using my understanding of containers, which works like a nest, I created a separate container for the
faces detected. This is important because of how the replicator COMP works. The replicator will create a
new TOP for each face detected, but as the live input feed continues running, the faces detected will
increase or decrease. Every instance where a face disappears, the TOP disappears with it, making it
difficult to connect the faces to the next operator since the node links will break when the face
disappears.
In my new container, I utilised this operator called the opview. The opview helps me to look into my main
face detection container, and using a line of expression, I can choose which face I want to use as an
input via their names. I’ll give one example of an advantage of using this expression and container
method. Let’s say I have 4 faces detected, face1 face2 face3 and face4. When face4 disappears, the
opviewer looking into face4 will return an empty background instead of breaking the connecting nodes.
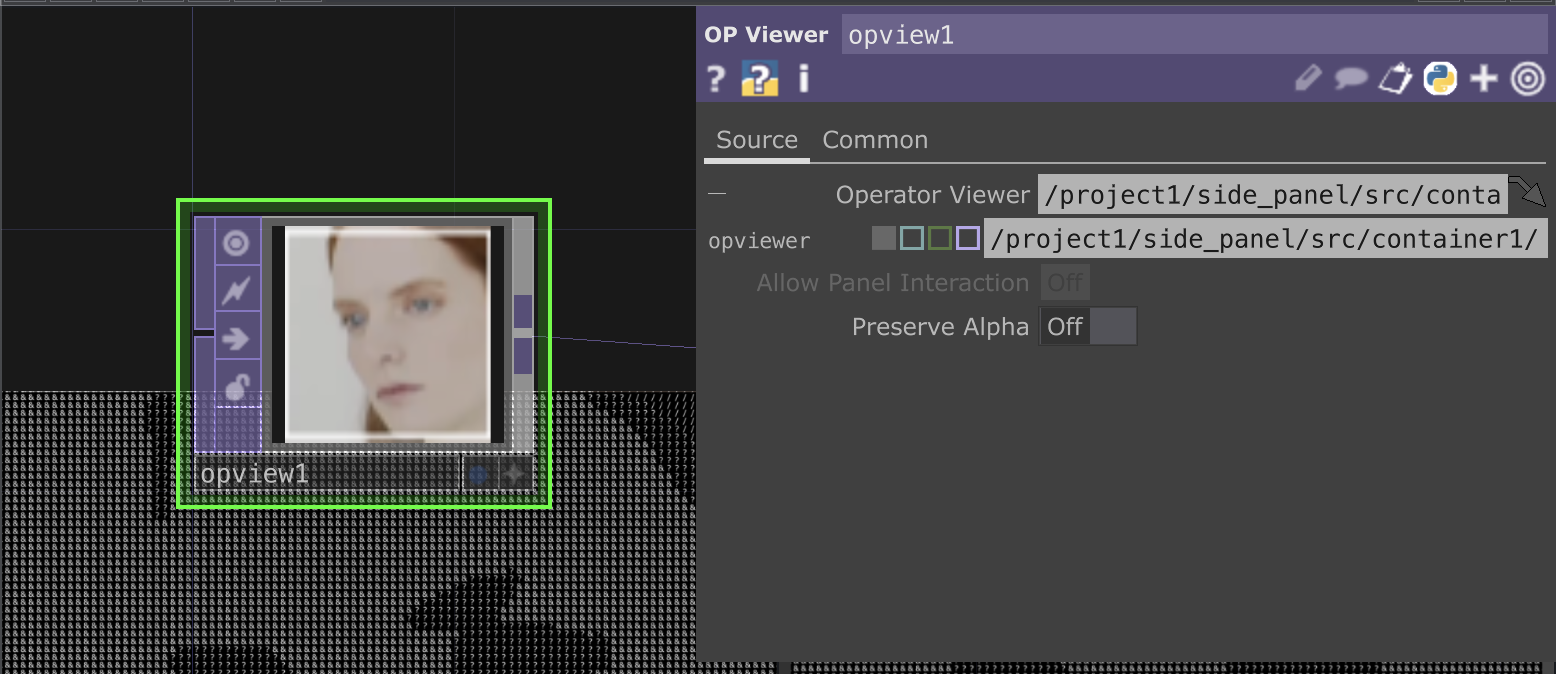
opview TOP
ASCII Faces and Layout
I copied over the same file I had used for my experiments earlier in the semester to achieve the ASCII
effect. I did have to reverse the colours to achieve the look I was going for using the Level TOP. I’m a
little concerned about how the pixels will turn out later on when the resolution is smaller. In my
previous experiments, I noticed that ASCII images don’t look good on small scale, they appear cluttered
and as for renders on TouchDesigner, the details are completely washed. I’ll leave this issue for later on
in the front end development, so I can work on the resolution problems all at once.
After some contemplation, I decided that a scrolling element would complicate the entire process without
adding much to the functionality. Therefore, I’ve come to the decision to limit the amount of faces
detected to just 9, which will simplify the UI layout and curb some of the resolution problems later on.
It was a difficult decision to make but considering how Haar Cascade’s face detection algorithm works with
small resolution faces, I think it works out.
Following a 3x3 grid system, I referenced back to the UI layout of the detected faces when I created these
small rectangles that frames the faces just as decoration. But now, they have a greater purpose, serving
as an indicator of how the maximum amount of faces that can be detected. Therefore, when there are only a
2/3 faces detected, the frames will still be there, leaving no empty spaces in the following rows.
I needed to create 9 containers, a separate container for each face, so I can lay them out. I’m not
exactly sure why TouchDesigner’s layout works this way but I’m not a big fan of it. The layout options are
in the container’s panel, here is where I can decide how many rows, columns, the amount of padding etc.
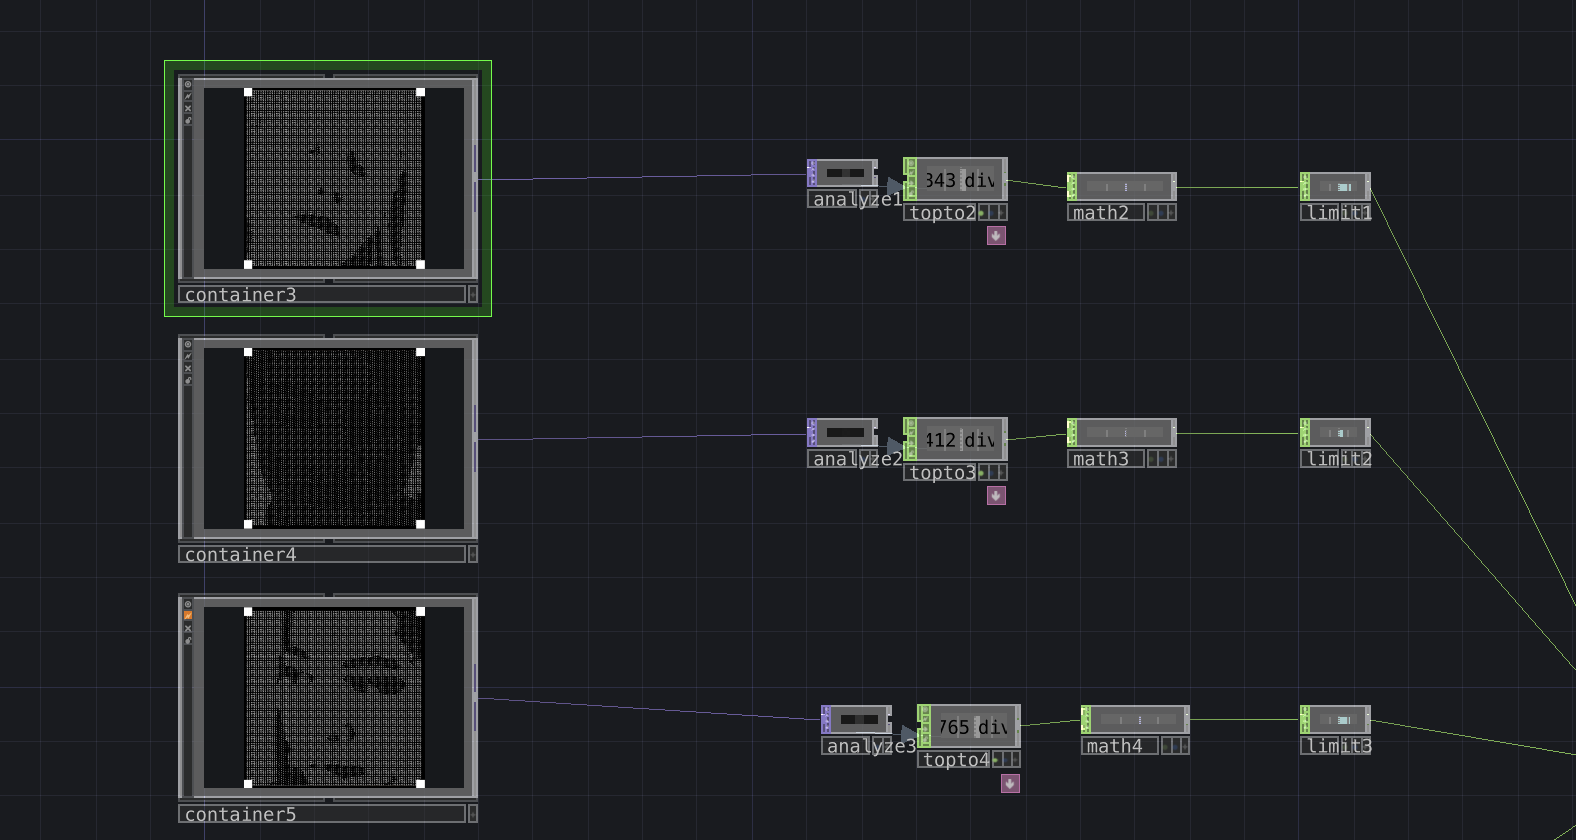
ASCII Images Pixel Smudge
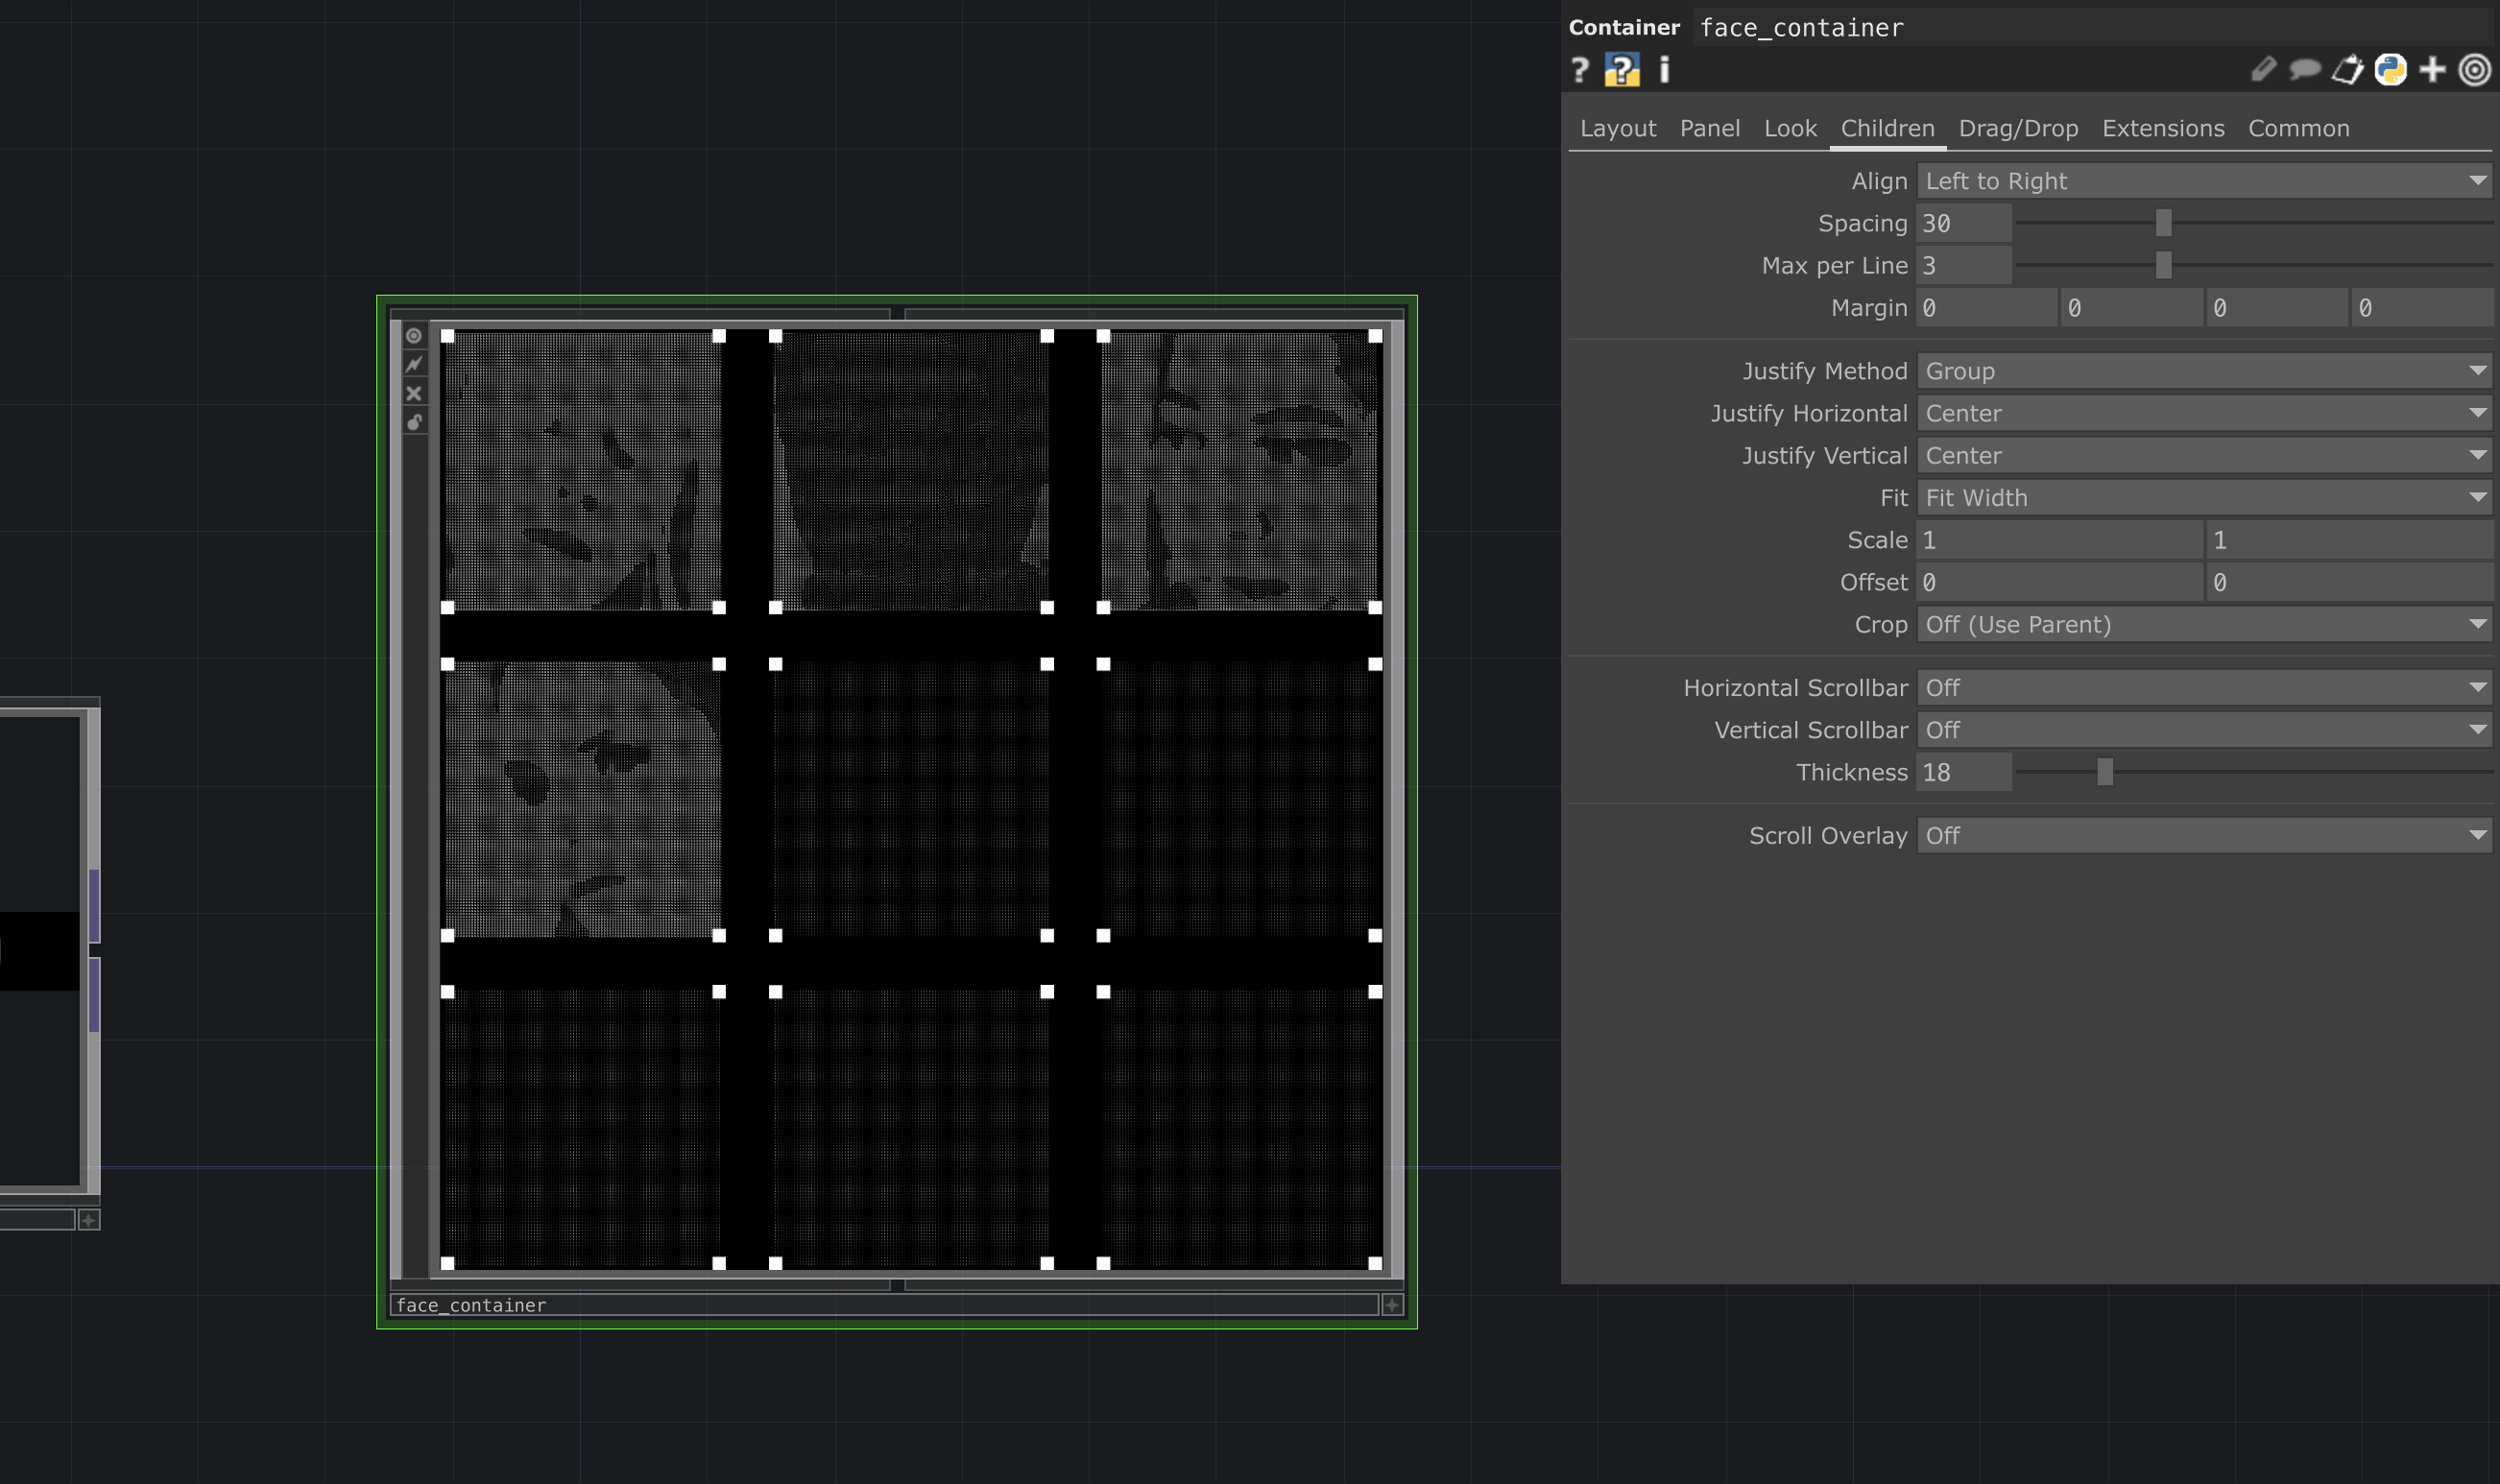
3x3 Grid
Calculating Pixel Percentage
Since we’ve converted the images into ASCII, we can now calculate the pixel percentage. To explain how
these ASCII images are created and why they are important:
1. These ASCII images are originally white on transparent, the black background is added in.
2. The way we converted the faces into ASCII is by converting the cropped faces to 100 by 100 pixels and
associating each pixel with a fixed set of symbols with increasing size/area (for example a fullstop is
smaller than a dollar sign).
3. The symbol each pixel takes on is dependant on the alpha values, giving it that depth.
Getting Individual Face Percentage
There’s an operator called the analyse CHOP, which scans the image and returns a value based on the
average number of pixels drawn. The value it first returned was a number with 4 decimal points, which was
difficult for me to use. I wanted a simple range, 0.00-100 so I can convert it to a percentage. I got the
analyse CHOP to scan through a completely white image (0.03922) and a completely black image (0.251), to
get an estimate range that the operator will return. Using the math CHOP, I converted this range to 0-100,
and applied a limit CHOP which helps me to limit the values to 2 decimal places.
Average Percentage
I had initially thought that calculating the average pixel percentage of the faces would be rather
straightforward, but the amount of faces detected is variable, so there’s an additional step needed to
compute this equation. Using the merge CHOP, I added the percentages of all detected faces together in a
math CHOP.
The evaluate DAT allows me to write an expression in a table, which can help me divide the sum percentage
of all the faces by the amount of faces detected. The logic CHOP is especially useful here. It works like
an off and on button, showing the value of 1 if it’s on, and 0 if it’s off. When there are no faces
detected, the individual face percentage will be 0. Therefore, I can tell the logic CHOP to turn off if
the value is not in the range of 1-100, so that any percentage below 1, will be forgone. Similarly to the
merge CHOP, I can add the 1s in the logic CHOP together using a math CHOP which will give me the value of
the total number of faces detected.
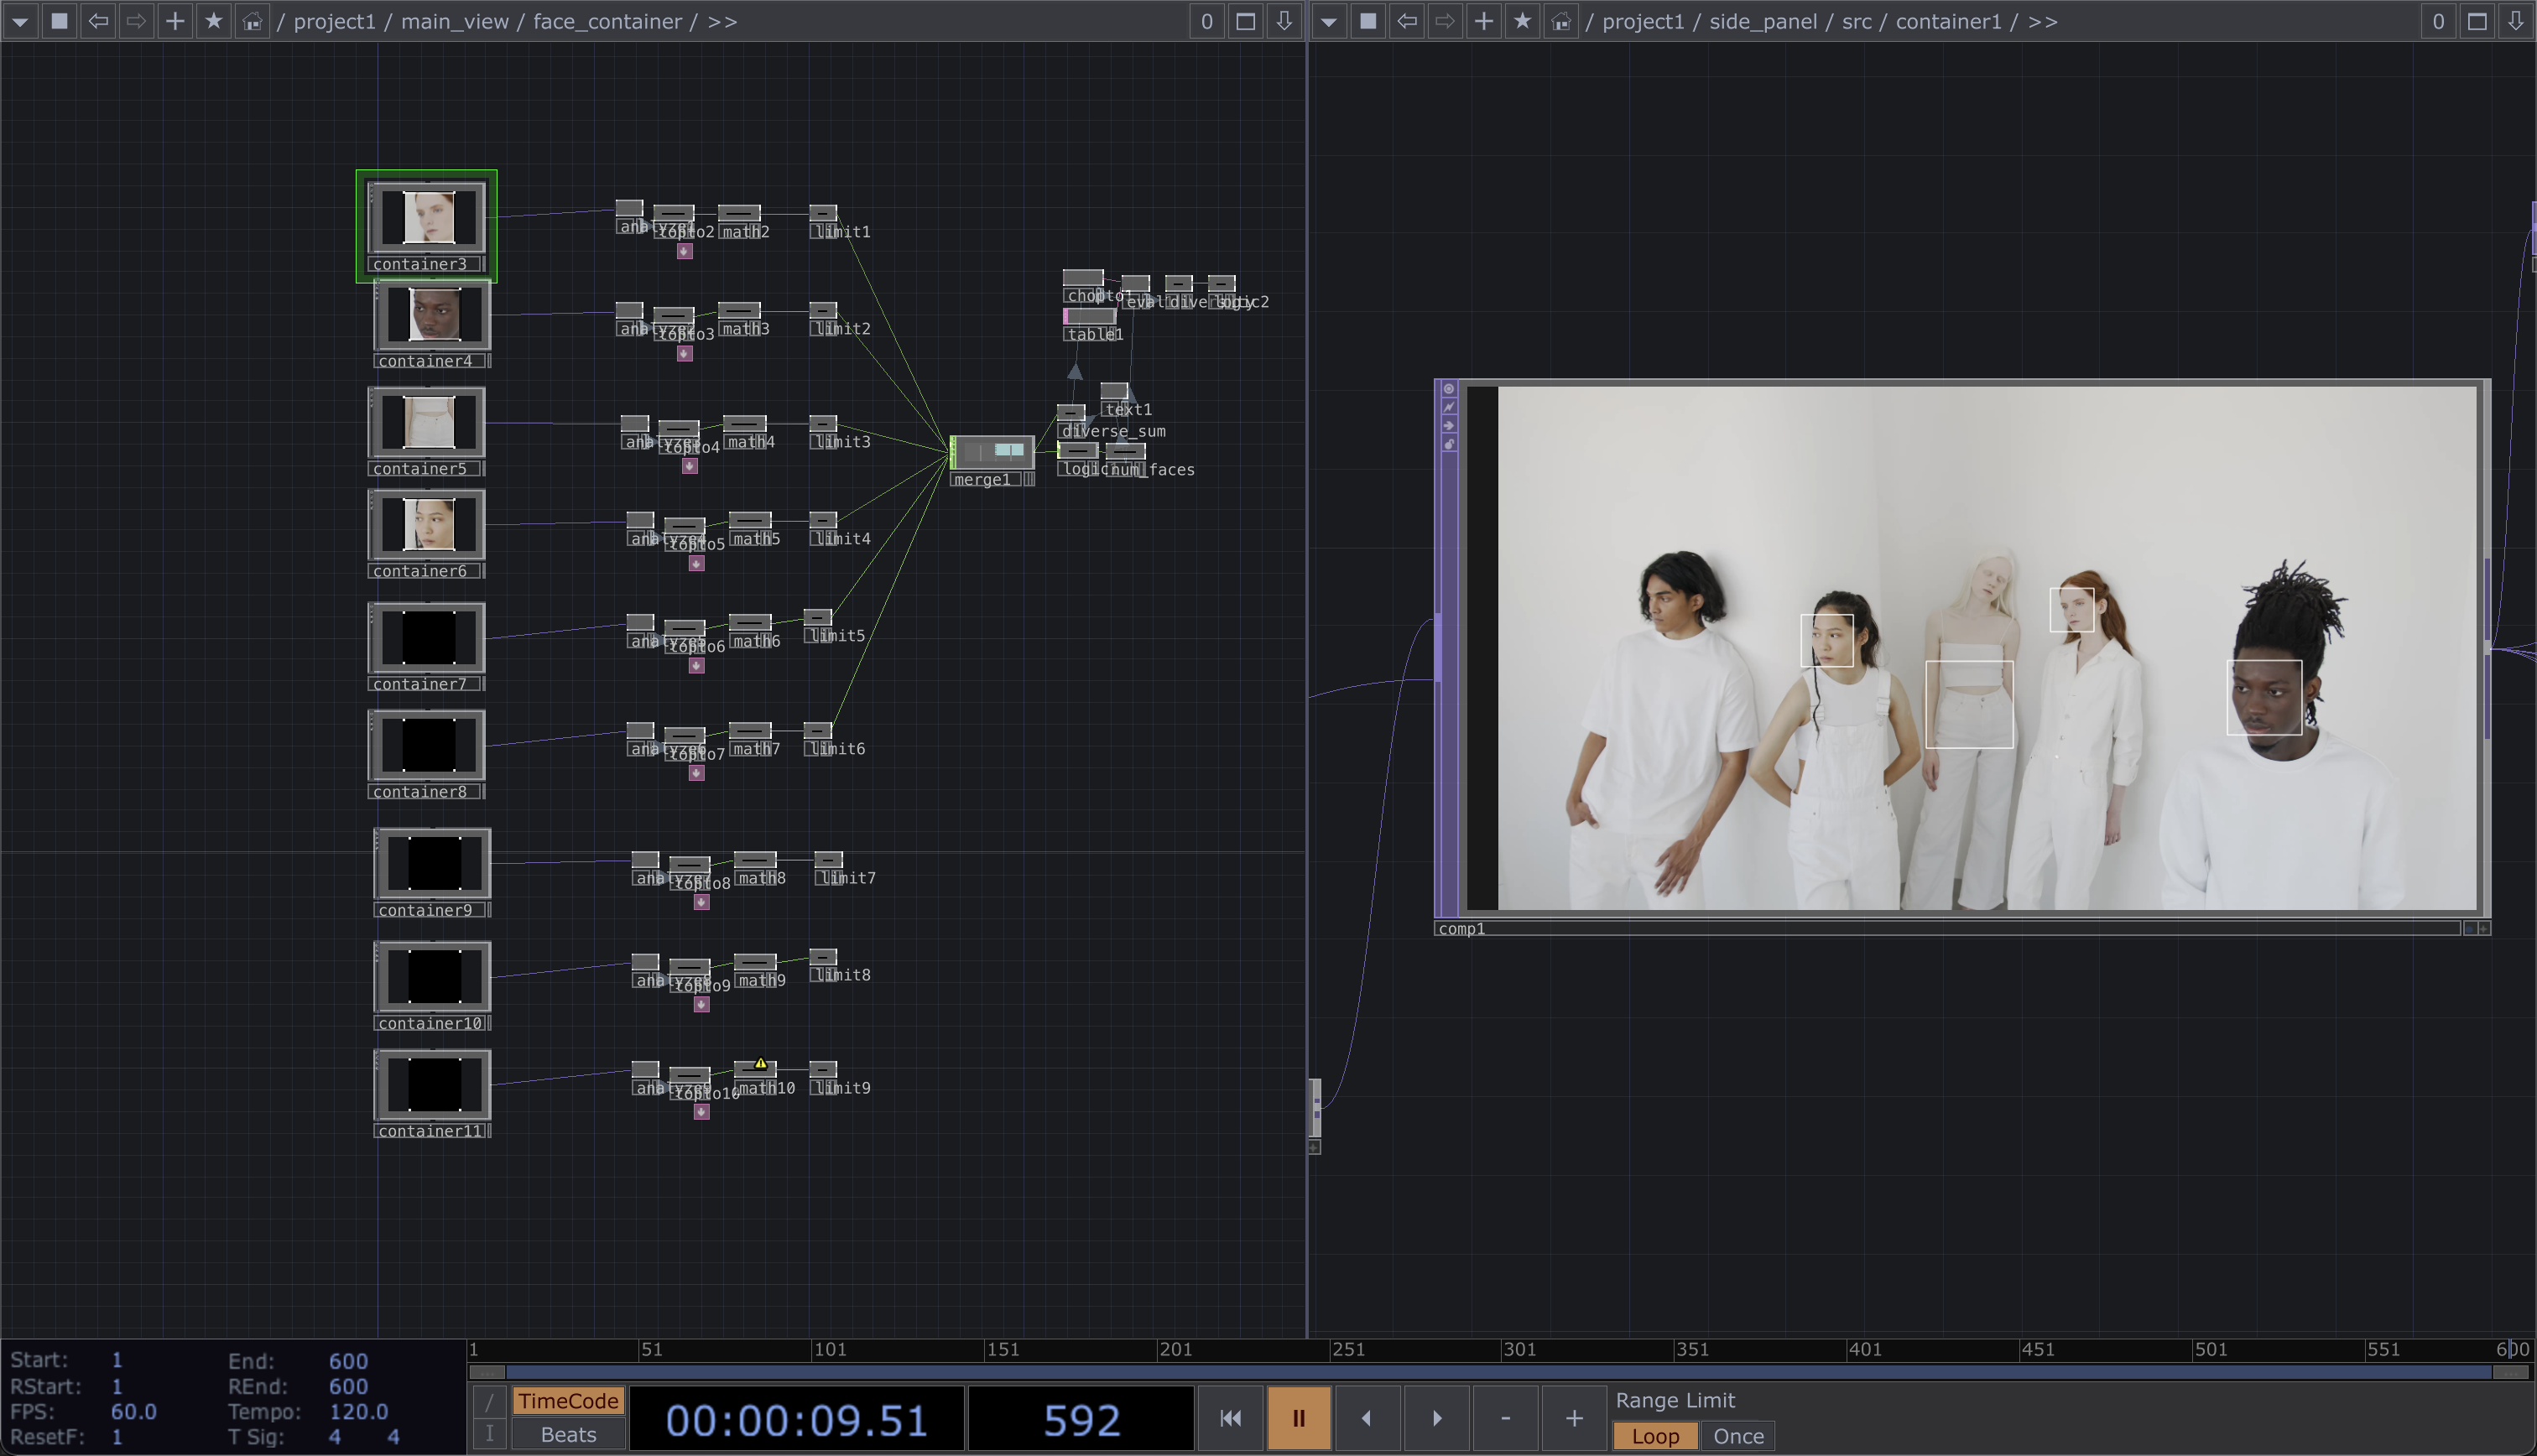
Nodes for calculating pixel percentage
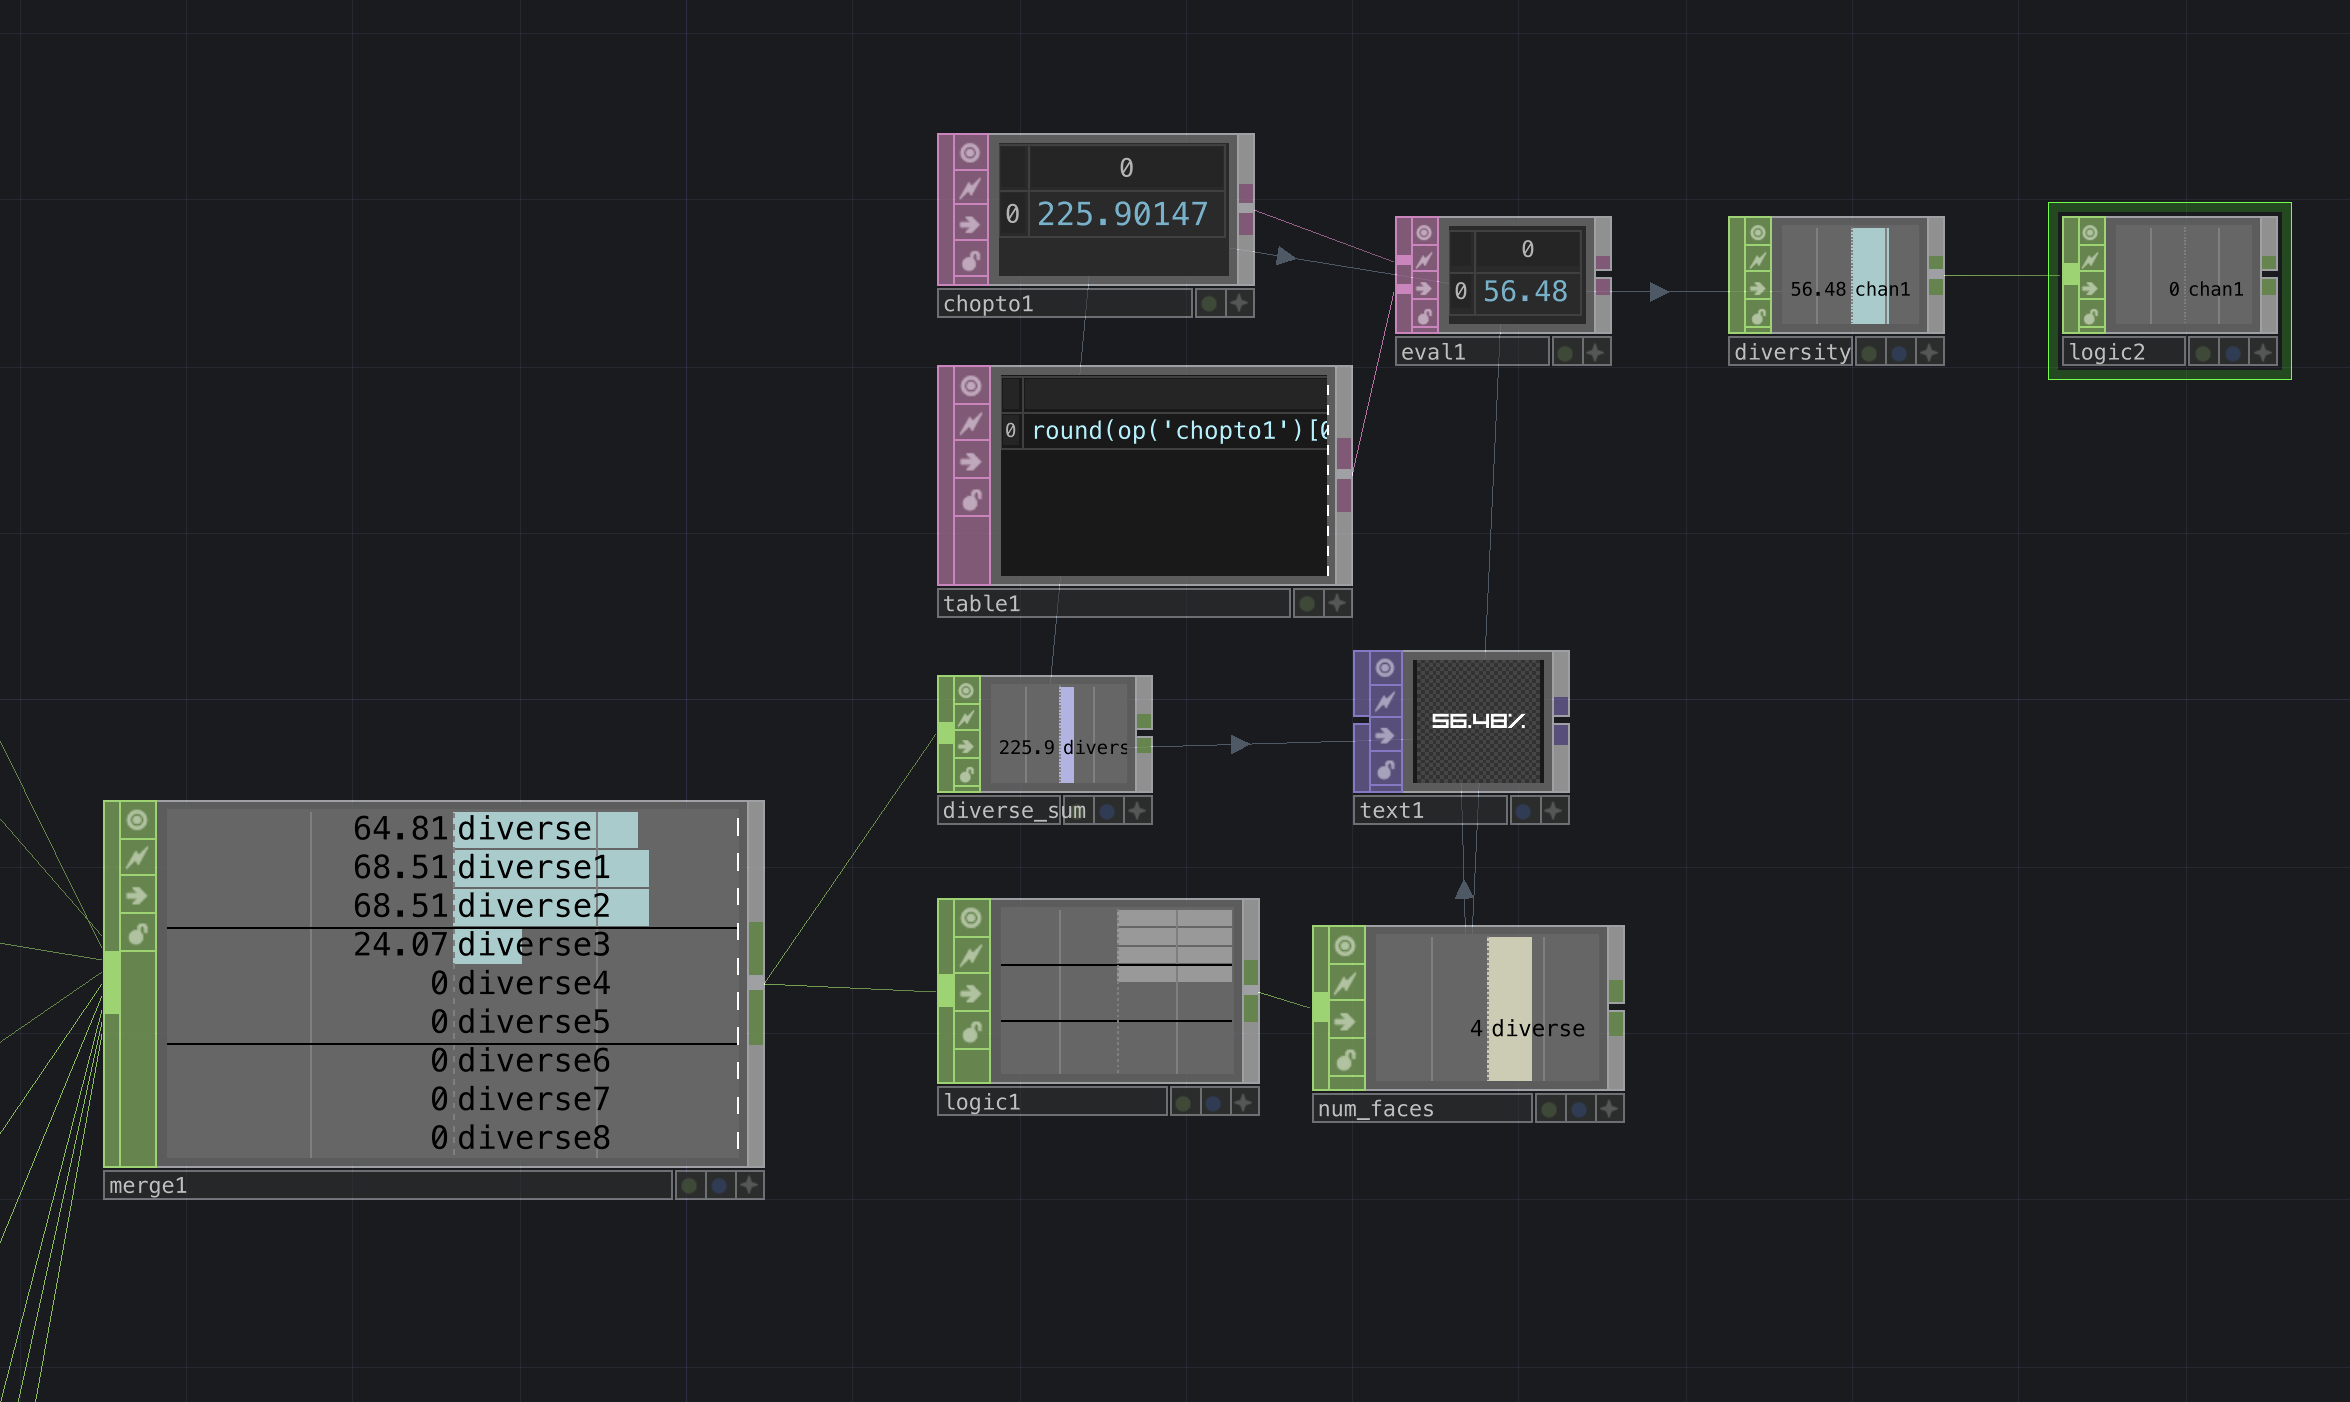
Merging individual percentage values and averaging
Button and Timer
The diversity percentage is constantly changing as the video input continues running, which is an issue.
For the sake of user friendliness, I want the percentage to only be displayed when a key is pressed, and
remain at the same value before it is pressed again.
In the video/image input container, I bind the play/active button on the input to a keyboard key so the
input wouldn’t be running during the scan. I tried to find some ways to grab a still image for the
scanning process but it didn’t seem like there were resources for that.
As for the detected faces, I wanted to have a transition from the original image to the ASCII version.
This decision is also made because when the original image is active in the view, the returned percentage
value will always be 100 as it has way more pixels than the ASCII version. If the ASCII effect comes in
after the keypress, I can demonstrate the correlation between it and the average percentage.
Initially, I wanted the ASCII effect to slide in from left to right, with some buffers in between. But
that proved to be a very complicated process due to how the crop TOP operator works. Andreas and I had
come across this issue earlier in the previous semester, when we found that the crop TOP works with a
fraction instead of resolution, therefore it takes a lot of manual trial and error to match the crop,
which is also inconsistent. To counter that, I figured the best way to do it is to begin the cropping in
the centre, starting with 0, and cropping out to the left and right edges, 1. This way, I can still
achieve a smooth transition. I also used a timer CHOP to which is called up in the expression, make the
wiping animation last for 1 second.
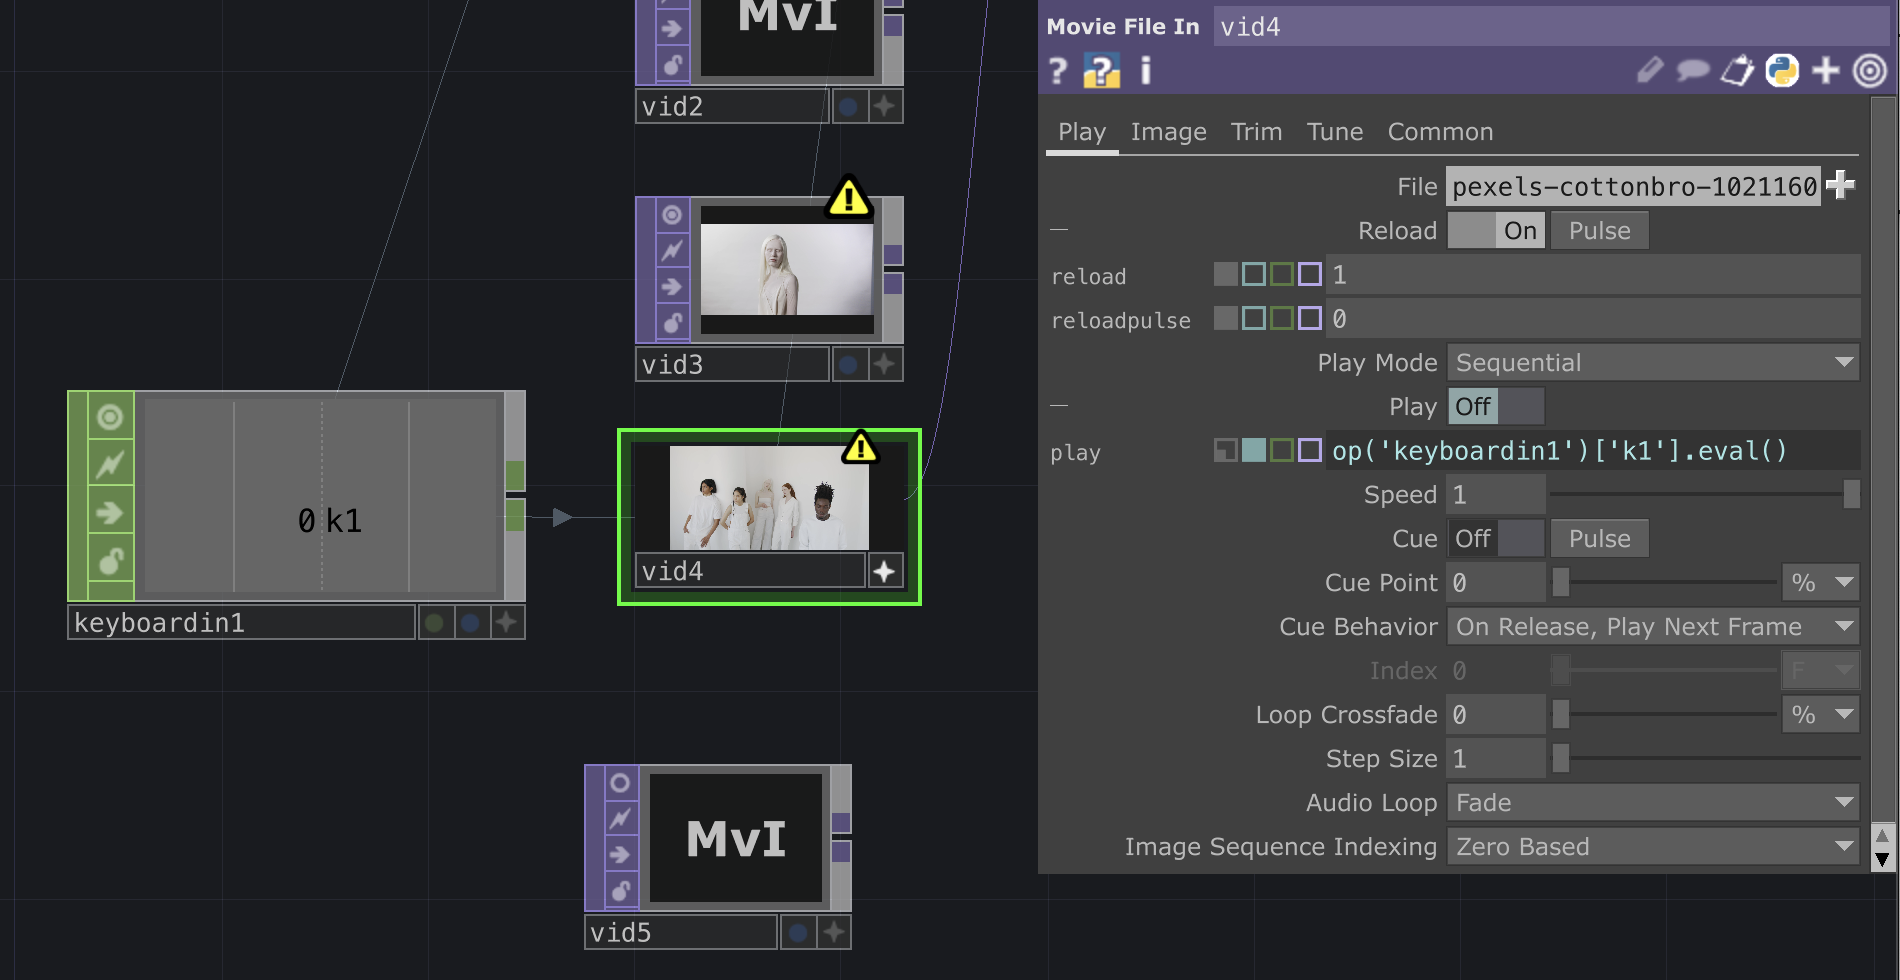
Keybind for play/pause
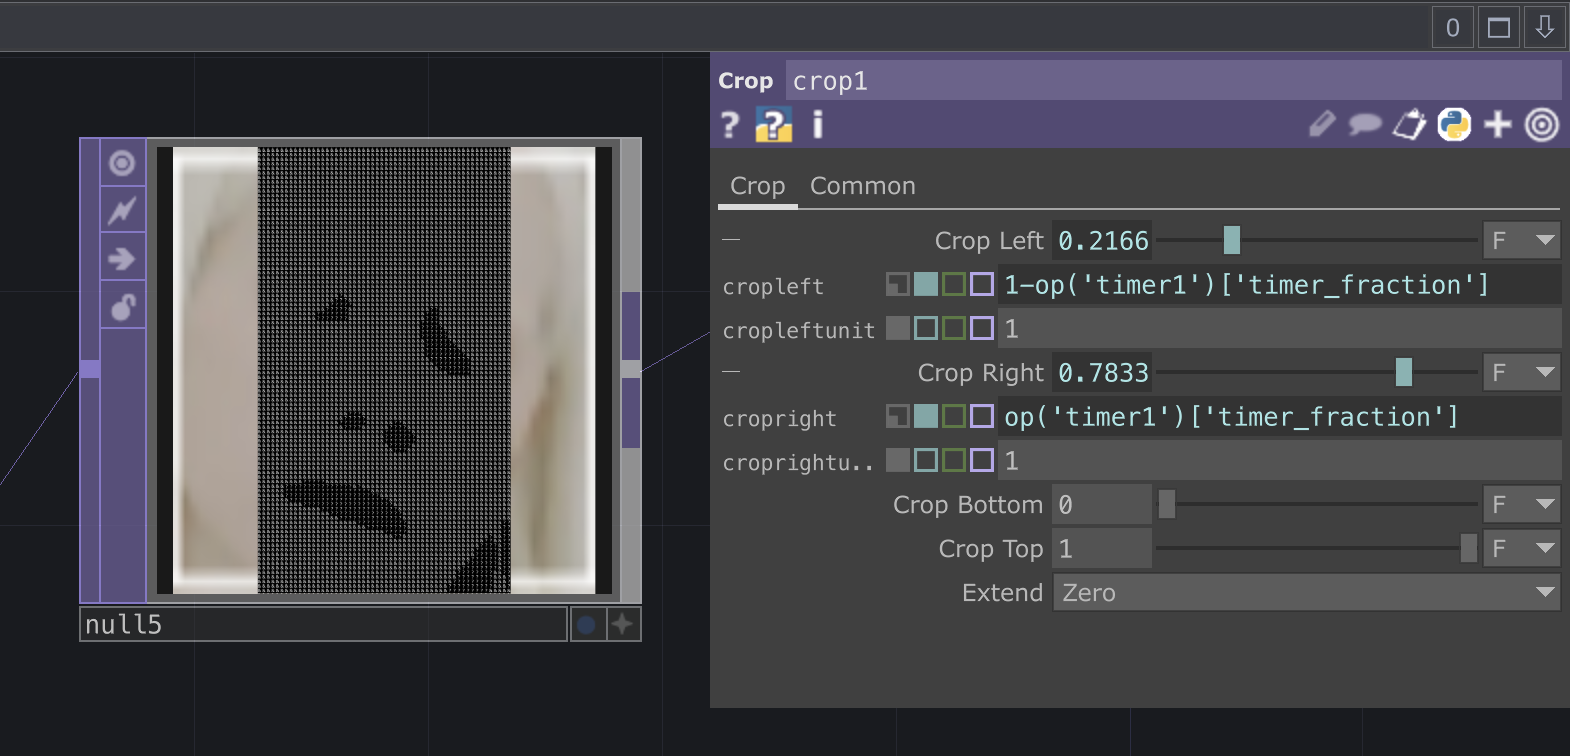
crop TOP for wipe effect
Diverse/Not Diverse Indicator
The software needs to be able to reflect whether the average percentage value is diverse/not. After
running a series of test with images that visually reflect diversity, I’ve found that the average
percentage usually sits between 45-55, thereby using that as the values to reflect diverse.
Using if else expressions, I wanted the text TOP to output to be diverse/not diverse. However, the Tscript
expressions in TouchDesigner does not support the common expression for range of numbers. I tried multiple
iterations of writing 45-55 for example, (more than symbol) 45 (less than symbol) 55, but the operator
just returned an error. Having learnt from my past mistakes, the quickest way to get this resolved is to
go on Reddit and got a reply 1 hour after I made the post. The solution was to use a logic CHOP instead,
and set it to turn on (1) when the value is in the set range of 45-55, which simplified my expression.
Before: op('table1')[0,0] if op(’diversity')['chan1'] (more than
symbol) 45 (less than symbol) 55 else op('table1')[1,0]
After: op('table1')[0,0] if op(’logic2')['chan1'] >0 else
op('table1')[1,0]
Quick Reflection
This is by far the most complex computation I’ve needed to do in TouchDesigner. Mapping out the
mathematical logic in my mind took considerable time, and it became a moment of realization—highlighting
the substantial progress I've made in mastering the software. In the past, even when I searched for
solutions online, I couldn’t really understand it unless it was a step by step explanation. The sense of
accomplishment and the dopamine rush I experienced upon successfully executing this complex task left me
genuinely proud of the skills I've developed.

Getting help from Reddit
Prototype Front End
The front end of the prototype encompasses the visual aspects, including font, colors, layout, and hierarchy. Due to time constraints, I haven't dedicated much time to the software's visual design yet. Despite this, all essential data requiring reflection has been completed. Currently, I'm considering whether to intentionally maintain the current state for my thought experiment, portraying an 'ongoing development phase' during the alpha test. While this approach would afford me more time for my dissertation, I aim to strike a balance that doesn't come across as overly casual. As I progress to my graduation project, I am committed to ensuring that the overall design meets my standards, enhancing the presentation of my speculative narrative.
Data Visualisation
The individual face percentage stands out as a crucial element that requires effective visual communication in my software. However, its creation is more intricate than it may seem. Given the variable number of faces, presenting the entire list at once could potentially confuse the reader, especially considering that the undetected faces would reflect as 0%. To address this, I utilized the level TOP to alter the text color of undetected faces to black when the value is less than 1, ensuring that only the detected faces are visible.
To enhance data visualization, I incorporated a bar chart, constructed of rectangles where the height directly corresponds to the individual percentage value. I also needed an indicator to show that the software is running in real time, showcasing its processing speed, so I added in a little element on time on the top left.
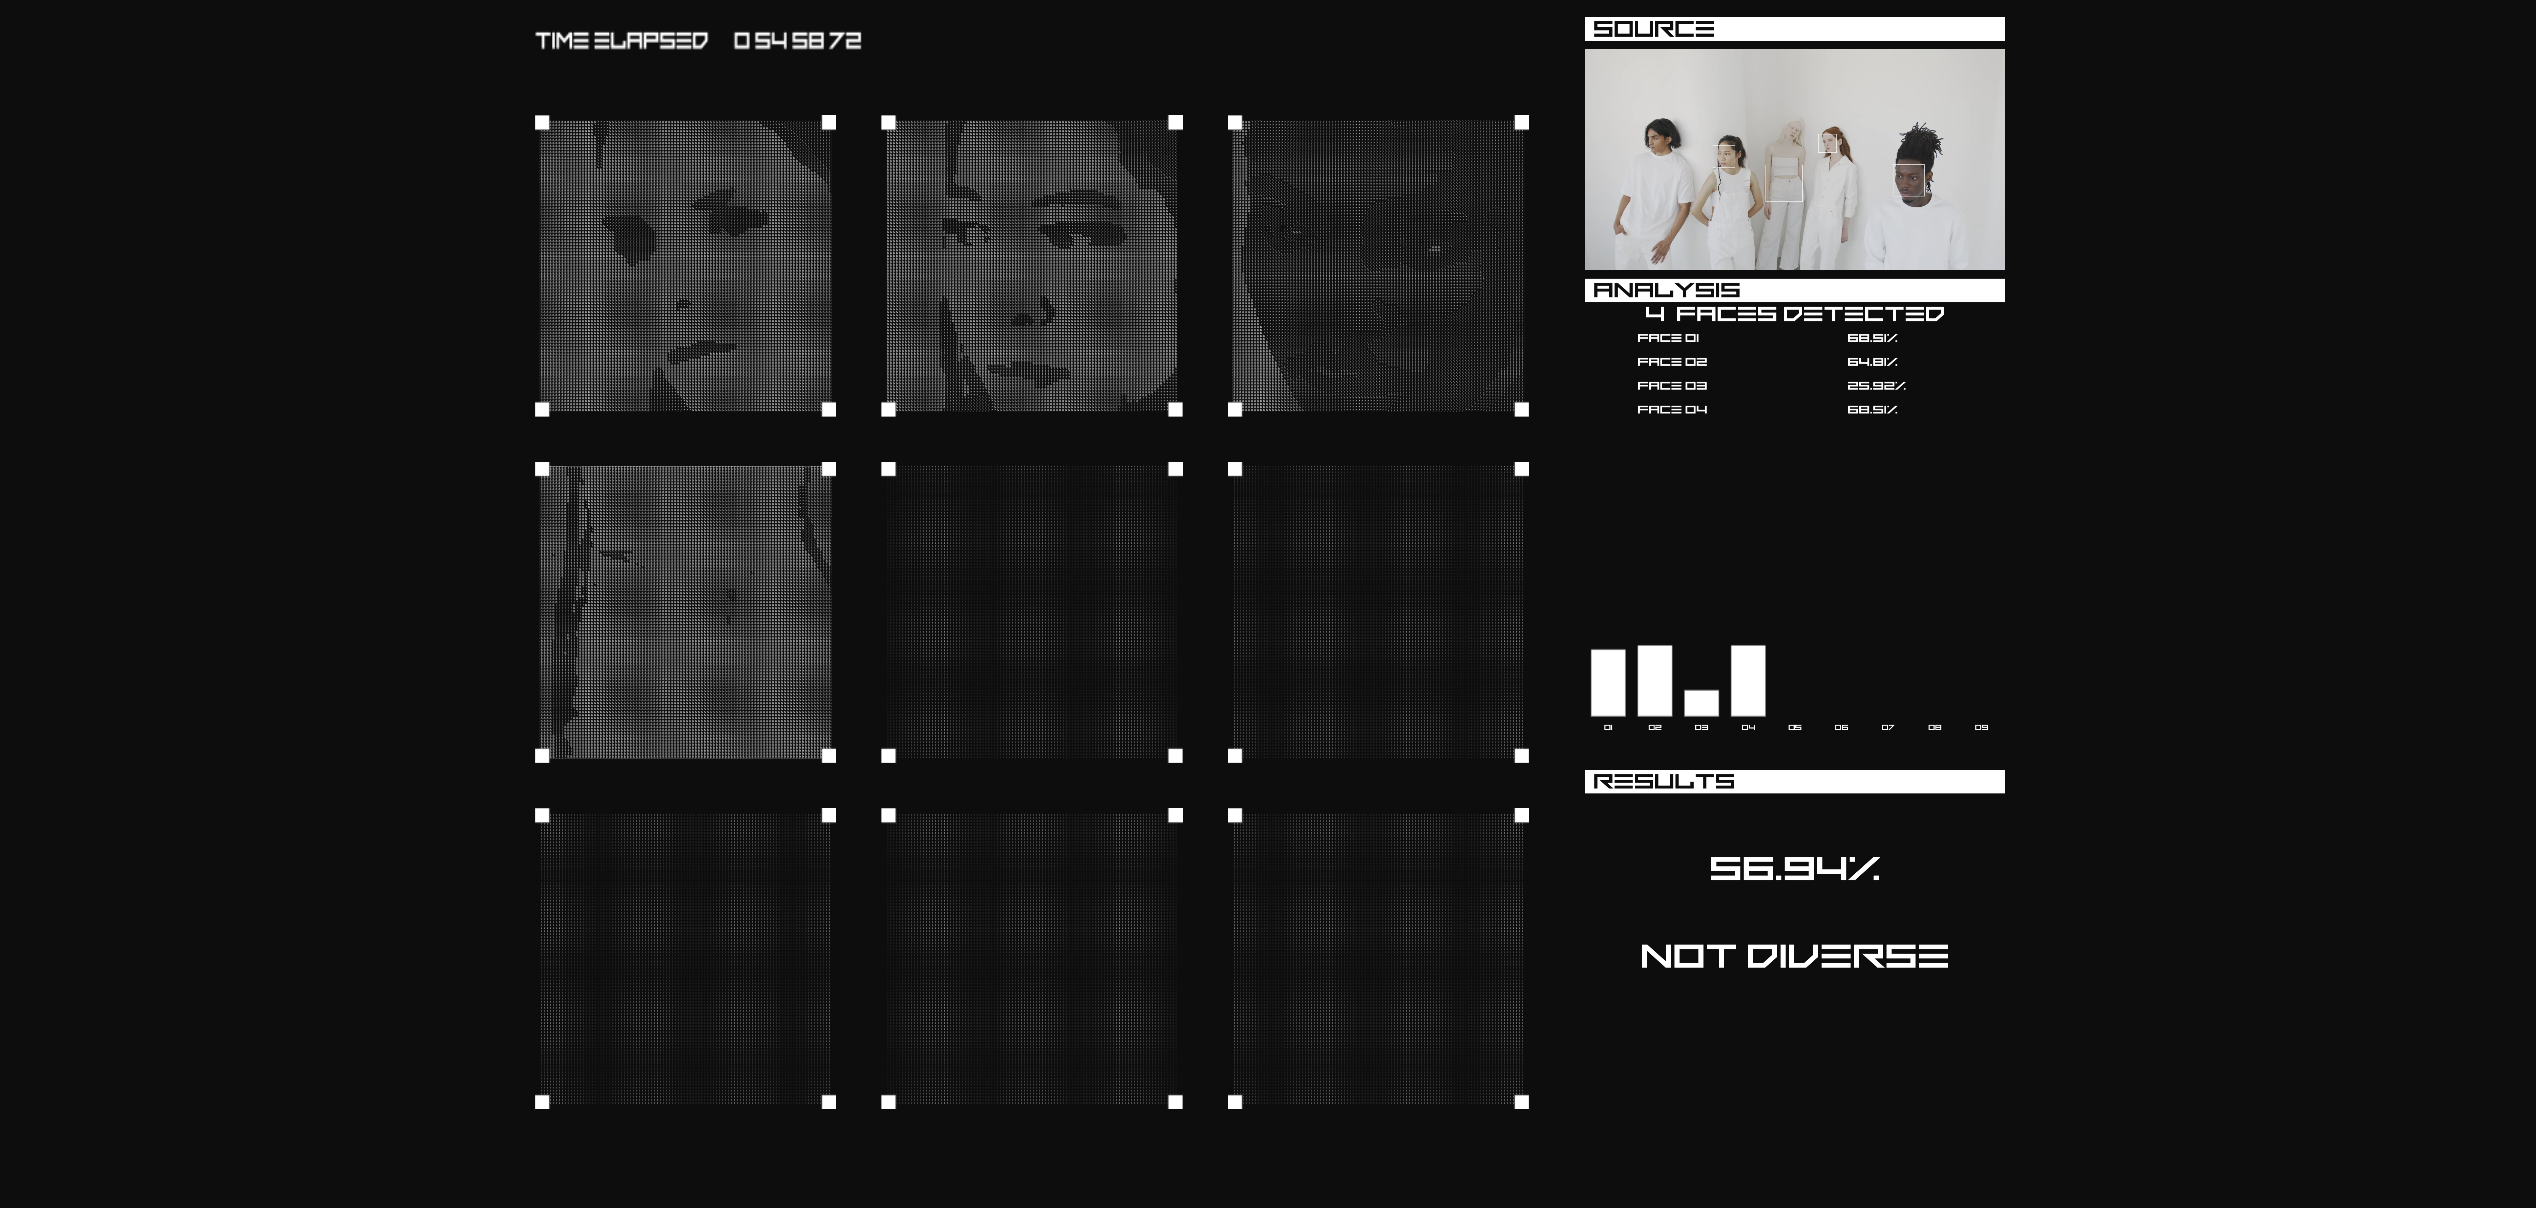
Algorithm Process View
Issues Faced & Limitations
The complexity of screen resolution is a primary reason for not extensively focusing on the front end. The interplay between layout and containers is crucial, and to avoid the hassle of editing each line of text individually within containers, I opted for a layout TOP. This approach allows me to manage the resolution of each operator more efficiently. Considering TouchDesigner's limitation to 1280px by 1280px (unless upgraded for $600USD), I must carefully navigate the space, particularly concerning ASCII images. Tweaking the size of the ASCII faces became a significant task to prevent them from being overshadowed within the confined UI space. As my final step, I plan to refine the front end after deciding on the ultimate look and feel.
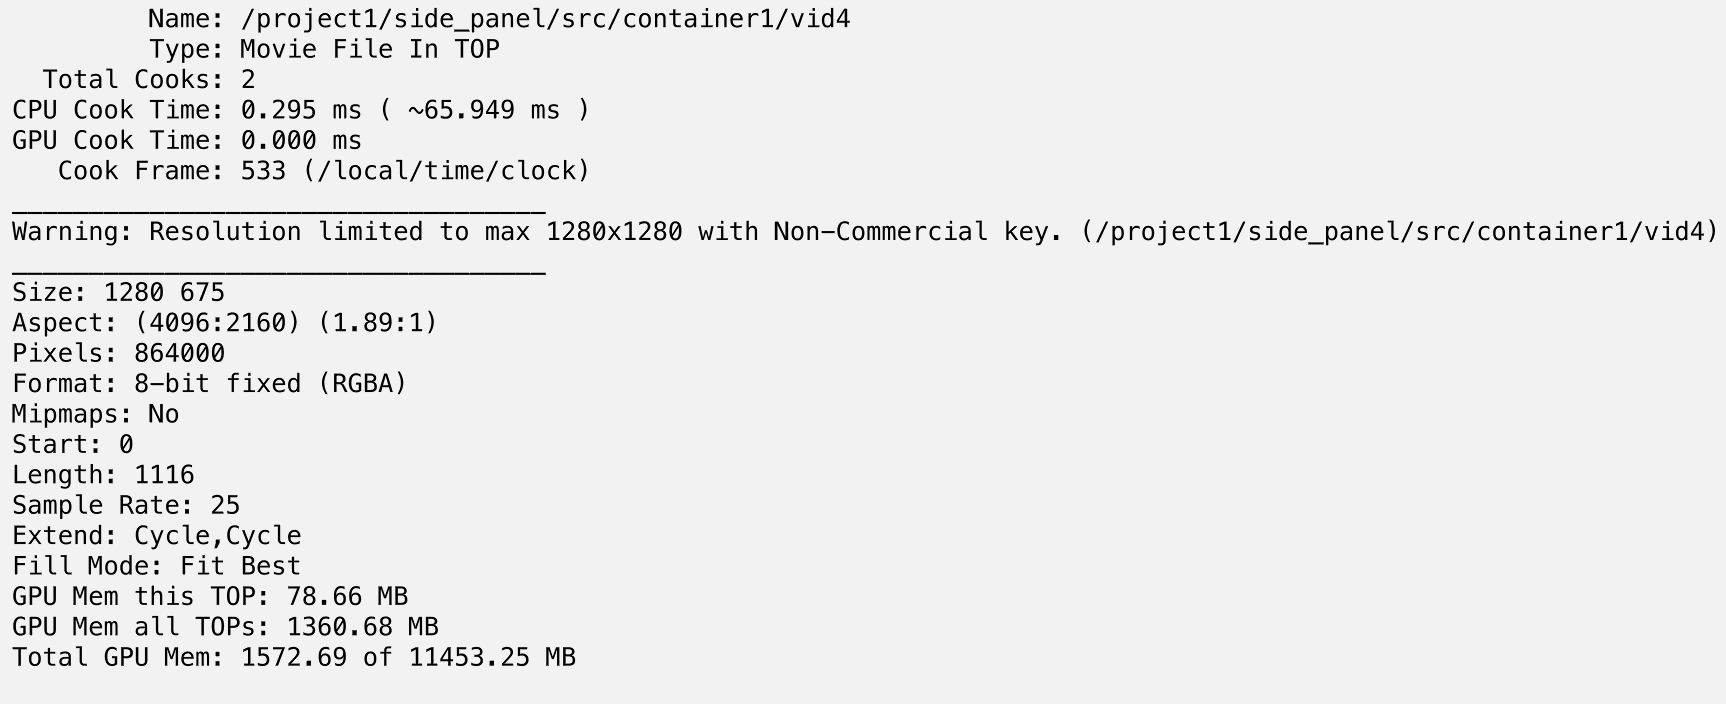
Resolution Limit Warning
Thought Experiment Flow
I created a flow diagram for Andreas to help him understand the flow of my thought experiment better. There were a lot of micro changes in my prototype during the semester break which were reflected on a macro scale. The speculative narrative I had initially has been tweaked. The narrative now is further driven by the purpose of the prototype (to mitigate filter bubbles and promote inclusivity).
In the flow diagram, I broke down the phases and demarcated when the thought experiment began. I also clearly outlined what can be expected in each phase so Andreas can better understand the timeline and provide his input.
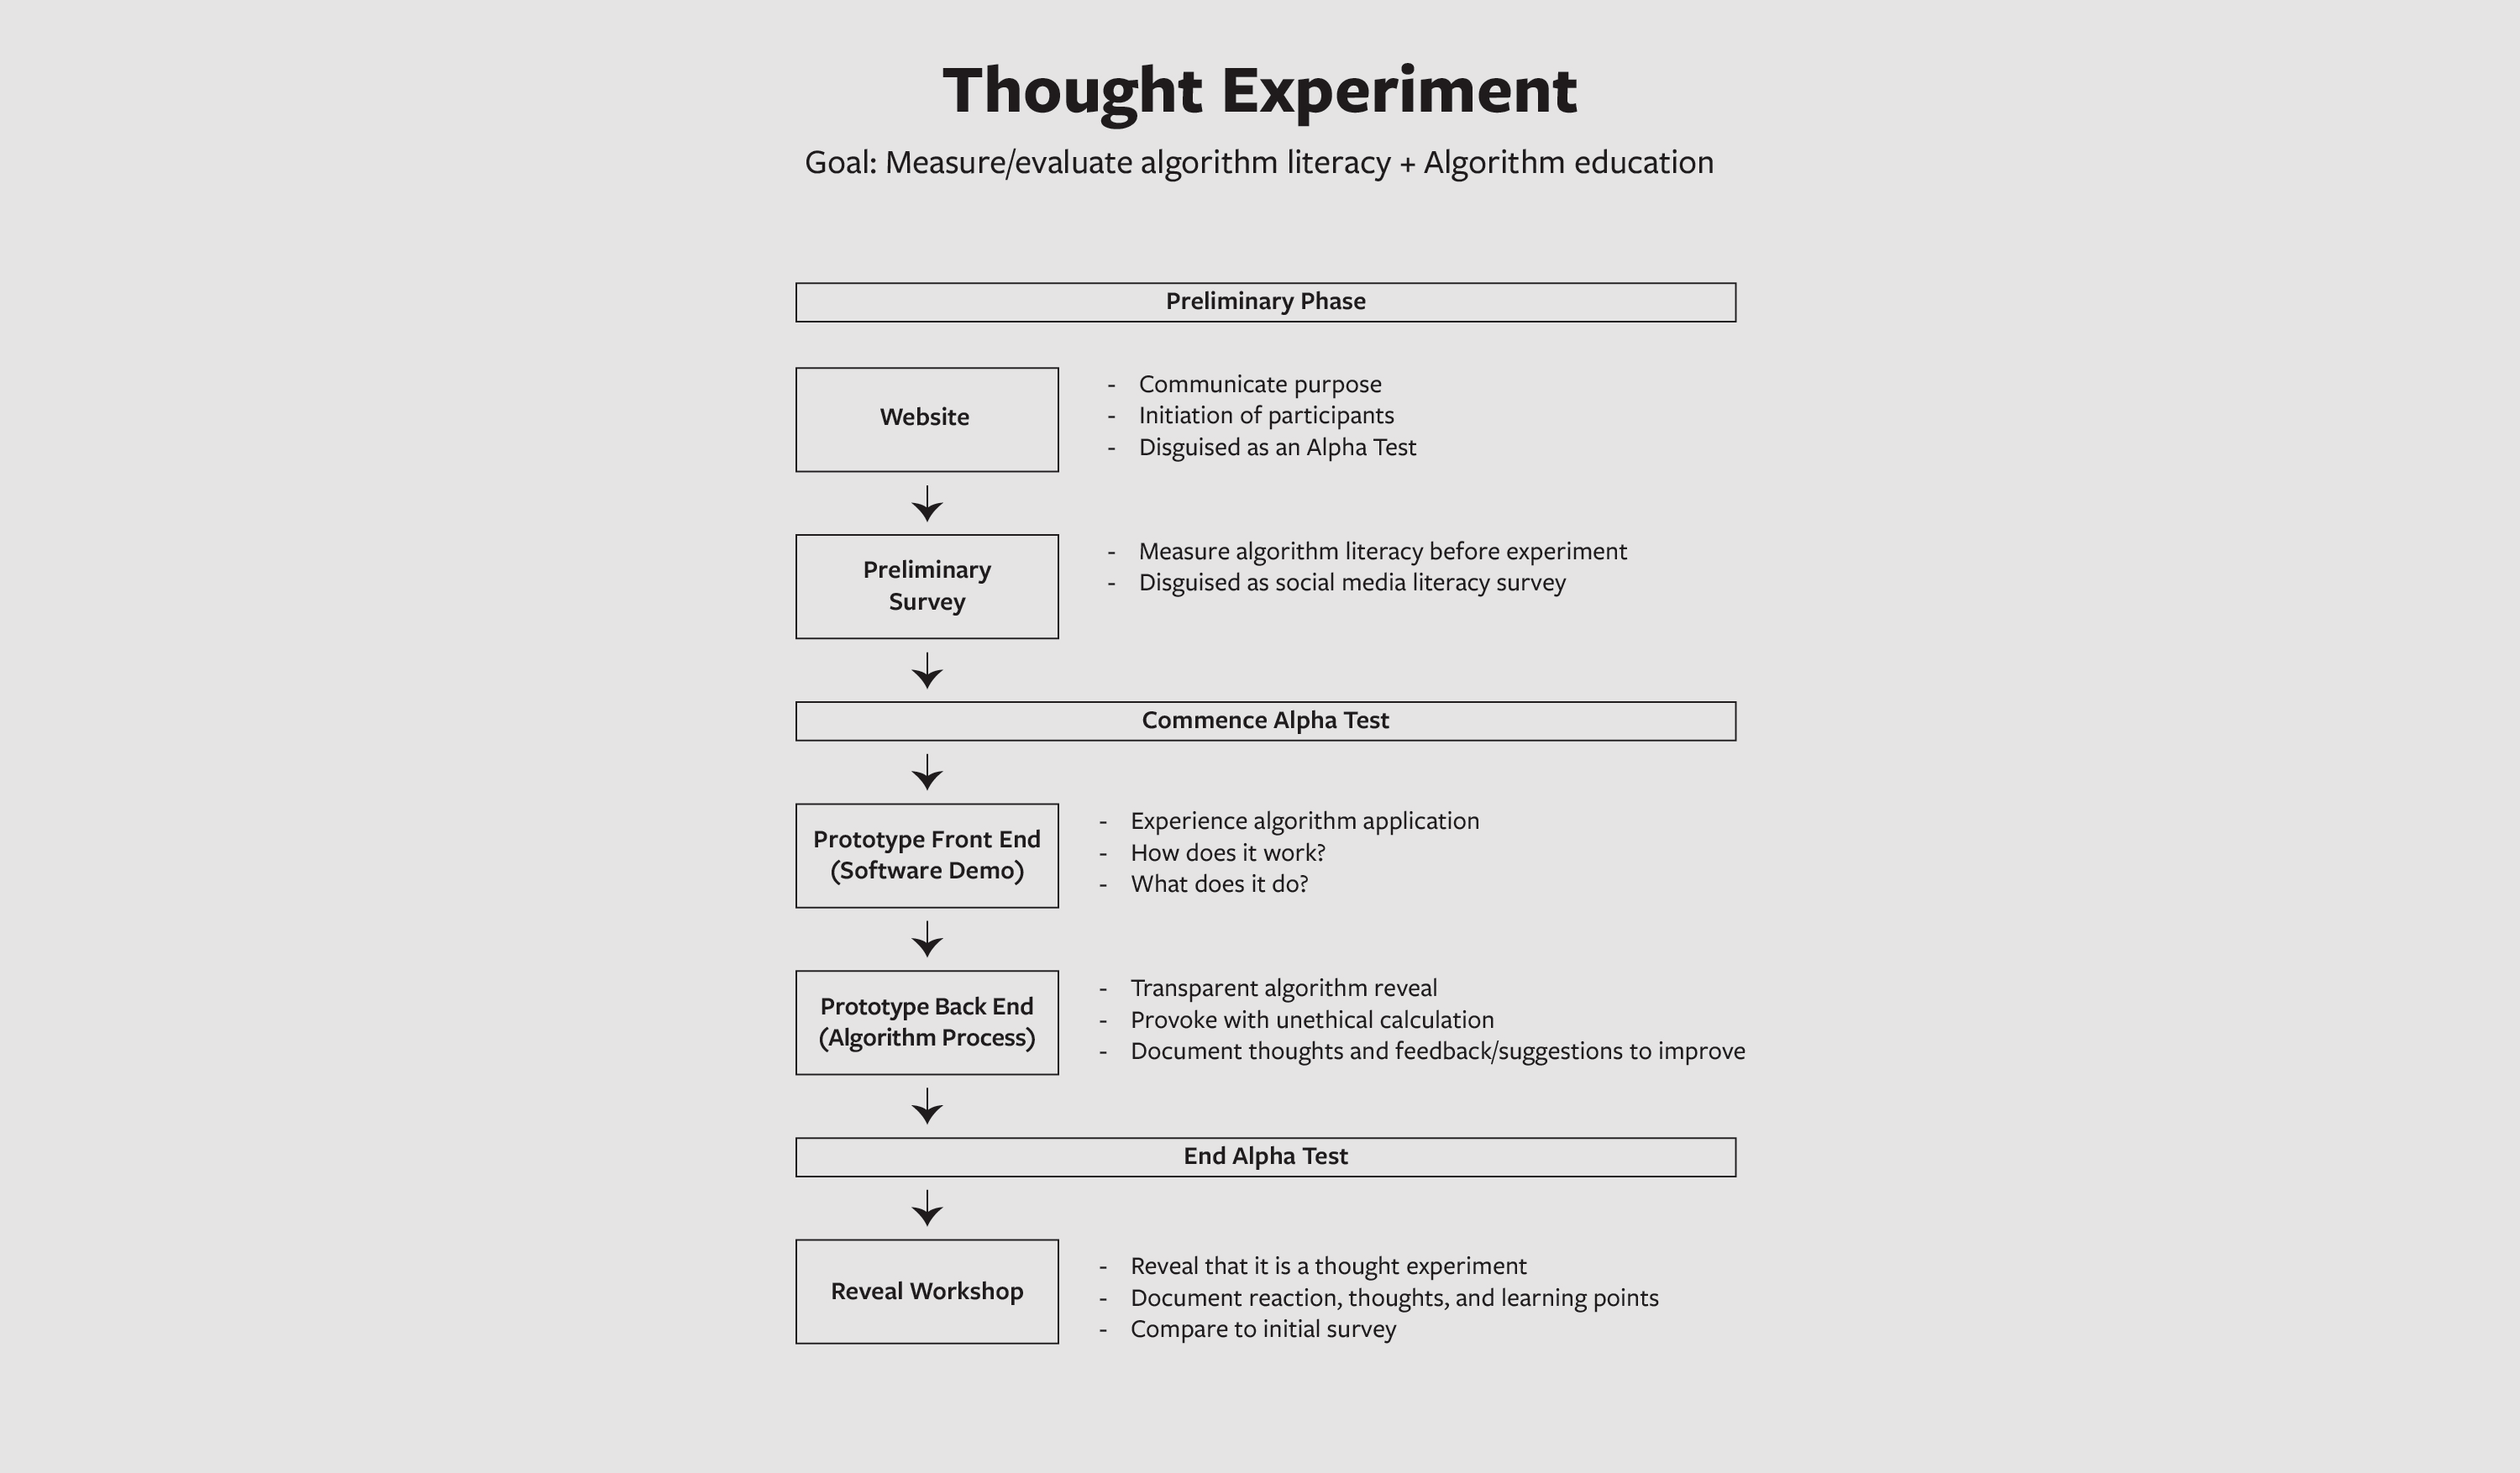
Thought Experiment flow diagram