▩▩▩▩▩▩▩ WEEK 7 ▩▩▩▩▩▩▩
Visualising my Pillars
To enhance my comprehension of the research pillars, Andreas assigned me the task of creating three short
10-15 second videos, with each video corresponding to one of the research pillars. Originally, his idea
was for me to employ various software tools to produce visuals for each video. However, I saw this as an
opportunity to get myself familiarised with TouchDesigner, considering I’ve never used it.
When approaching a new software, my preferred method involves dedicating initial time to grasp its tools,
and interface, and, notably, familiarize myself with shortcut keys. I've discovered that this approach
significantly enhances my workflow and efficiency.
Having prior experience with Spark AR, another node-based software, certainly facilitated my comprehension
of how operators in TouchDesigner interconnect. However, I did encounter a bit of confusion when it came
to connecting operators from different families. Furthermore, there were instances in the tutorials where
Python scripts were introduced, adding another layer of complexity. Personally, I'm inclined to steer
clear of these scripts to maintain simplicity in my approach.
Drawing from my past encounters with computational design, I've found that it's more productive to begin
by exploring references and tutorials before shaping a specific concept. Understanding the software's
capabilities, which operators to employ, and the types of input and output it generates is crucial. Armed
with this knowledge, I can subsequently rearrange and interchange the operators to achieve my desired
outcomes.
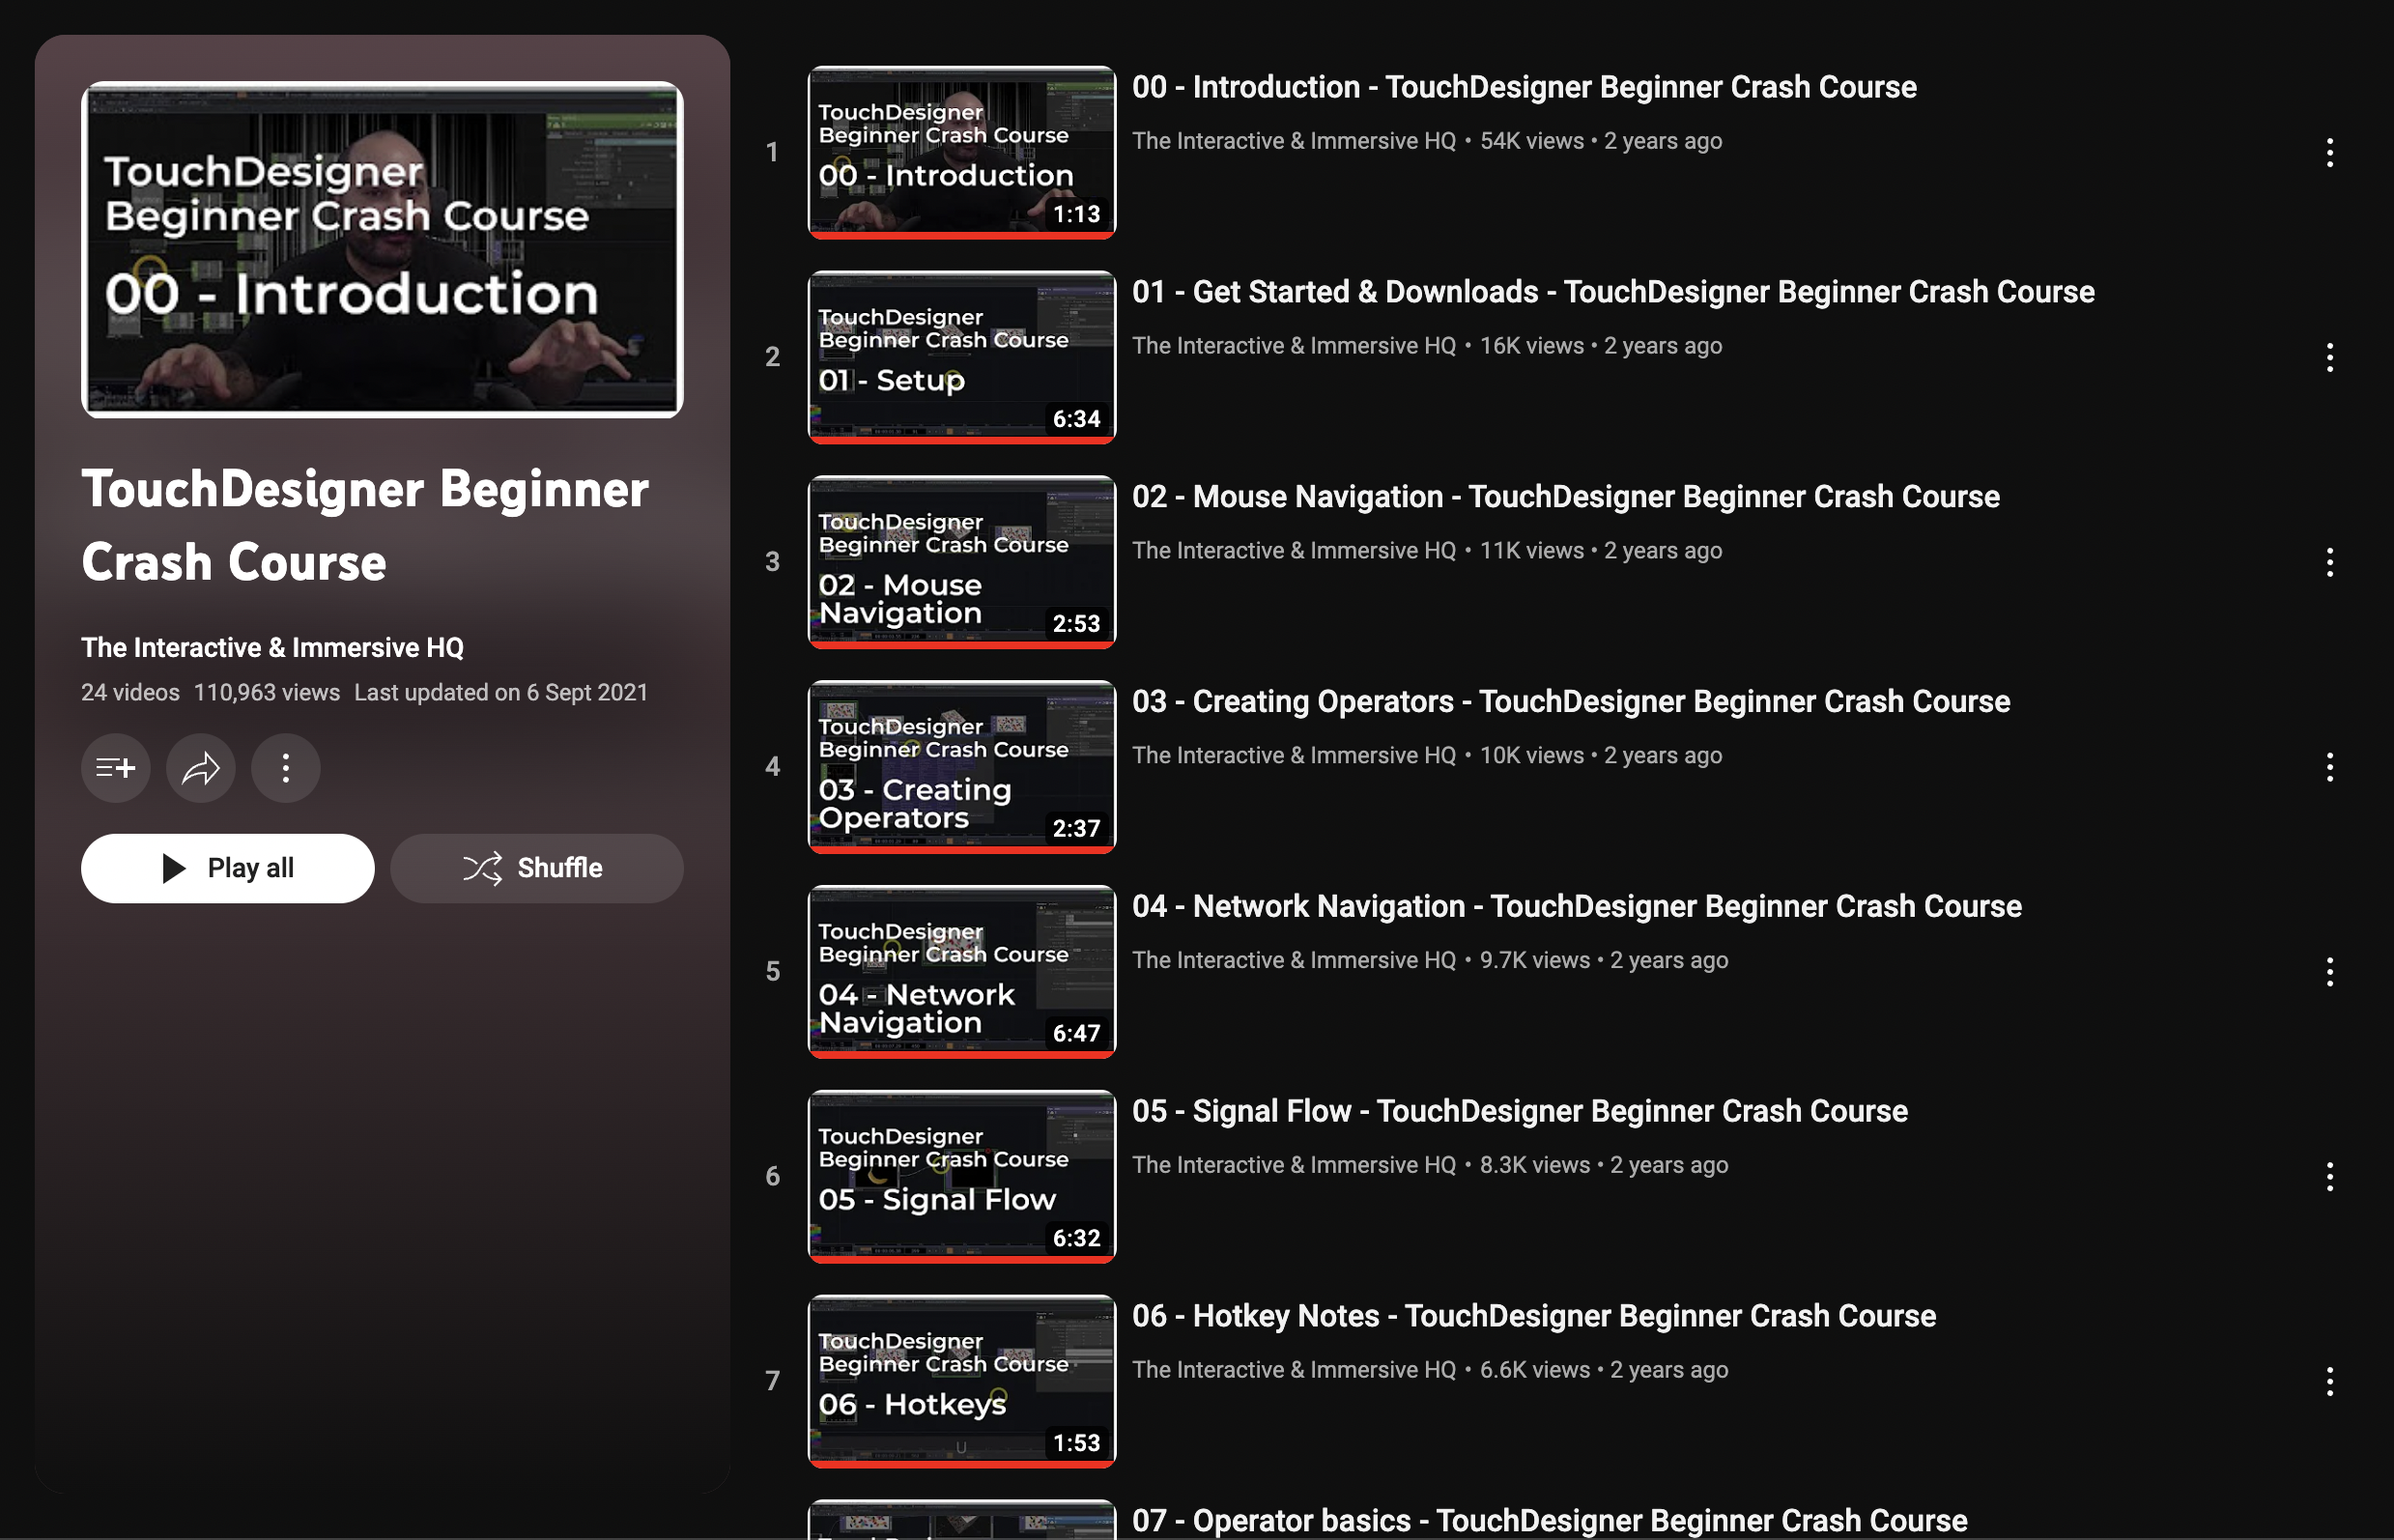
Learning TouchDesigner
Experiment 1 – Algorithm Dilemma
While exploring ASCII tutorials involving DatTables, replicators, and the webcam, I noticed that the concept of pixel characters resembled what I had encountered in p5.js, using similar variables. As I delved into the code and experimented, I decided to switch the input to noise. What stood out was the availability of various types of noise in the dropdown menu, offering more options for visual experimentation compared to p5.js, where I often had to refer back to the p5 reference for specifics. By adjusting the TOP noise operator slider, I achieved several generative outcomes that I could potentially piece together to construct a narrative related to my research pillar.
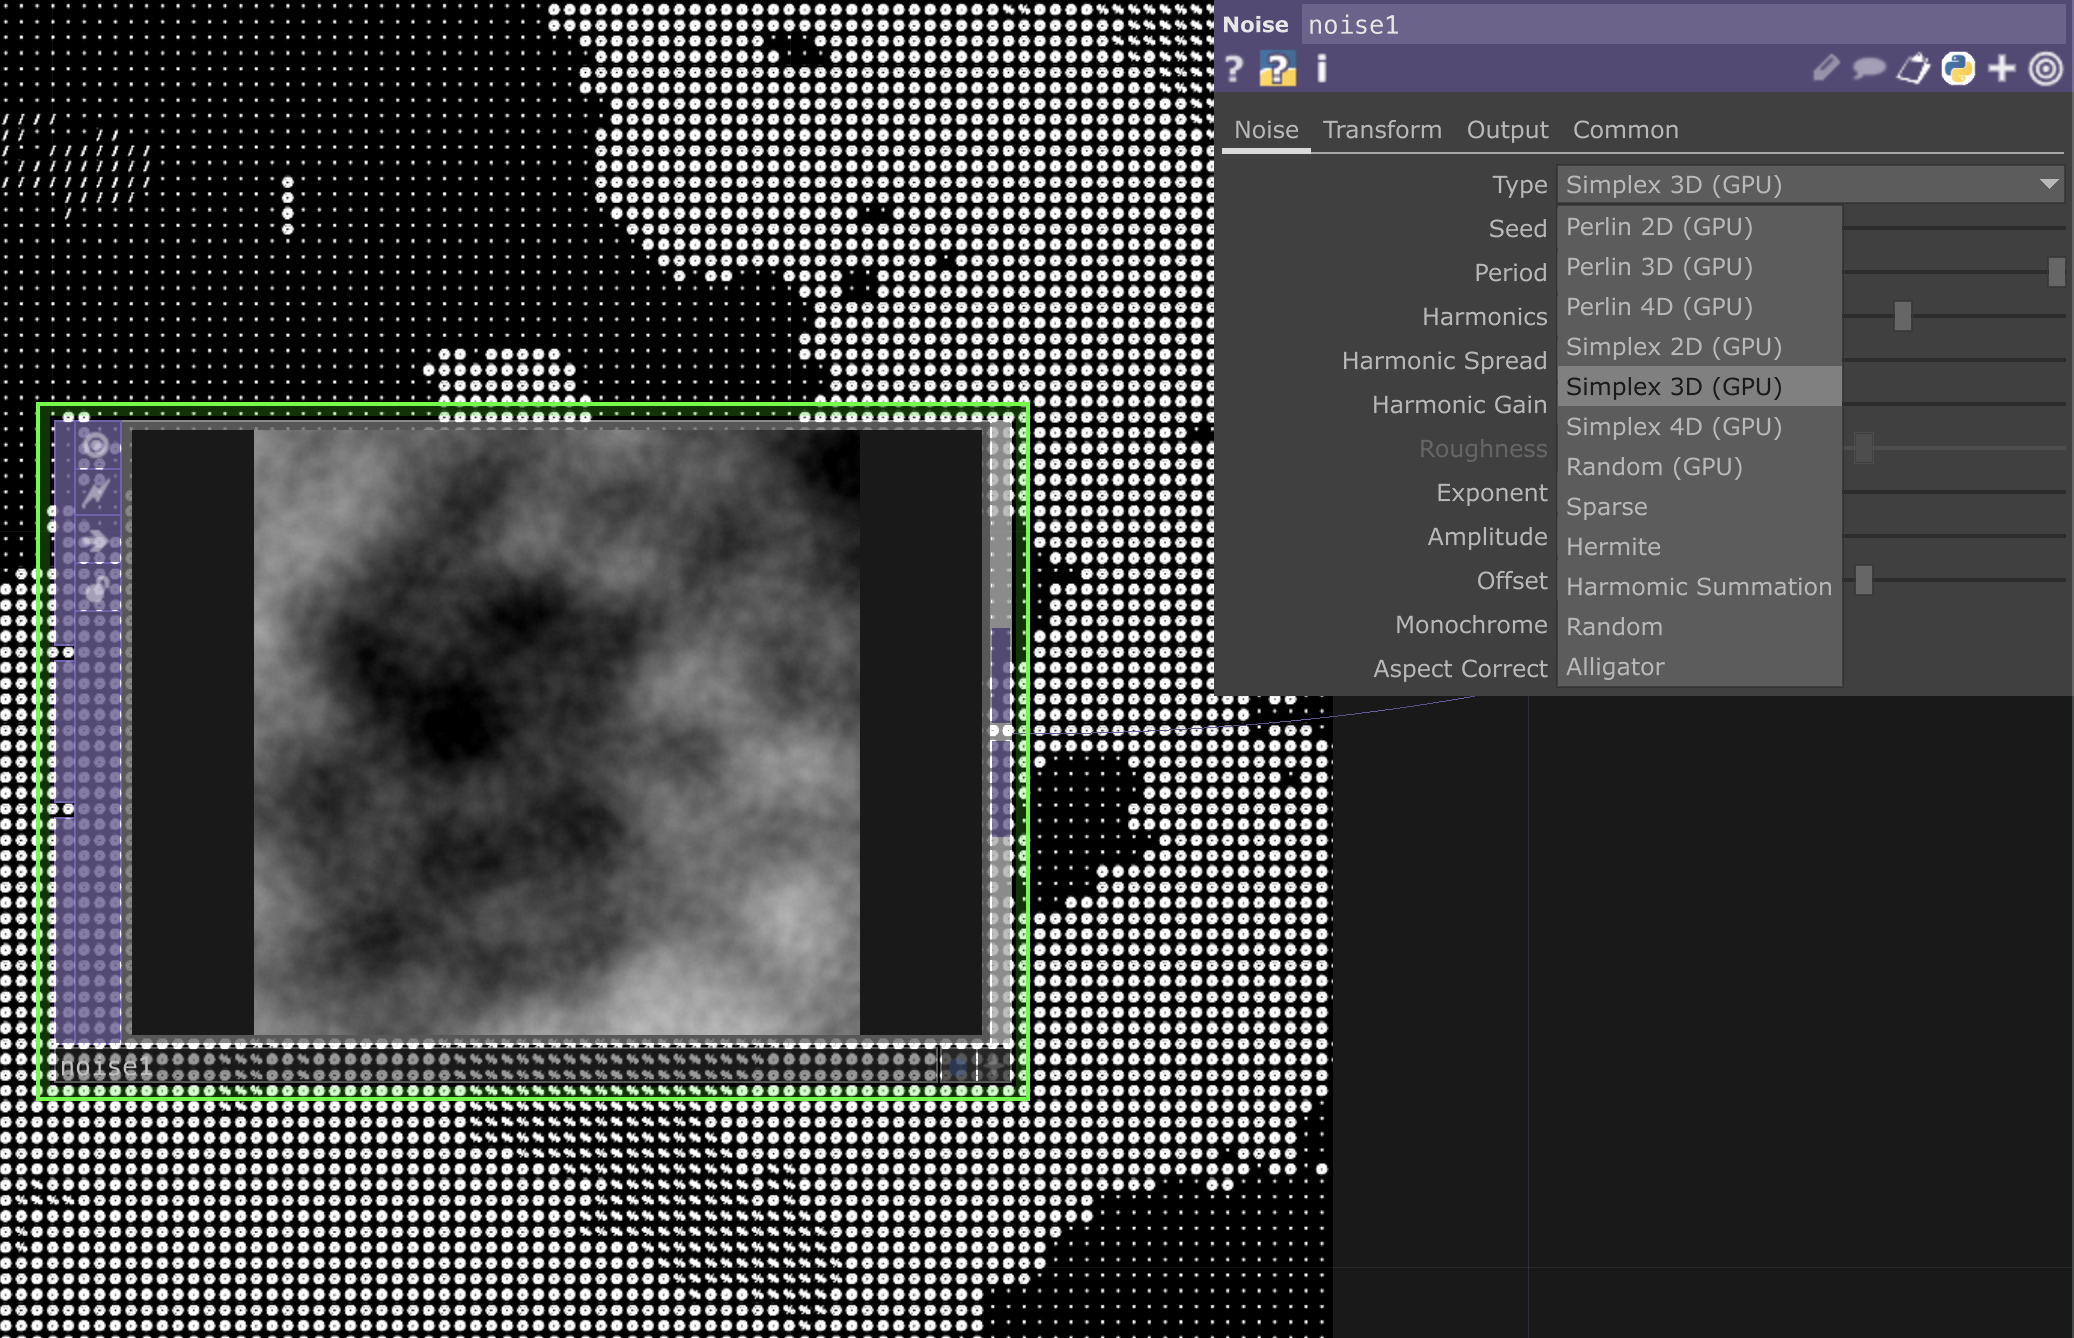
Noise filter options

Algorithm Dilemma Visualisation
Experiment 2 – Algorithm Literacy
In my second experiment, I took a different approach. The tutorial I followed led to significantly
distinct visual outcomes at different stages of the process. This experiment involved more complex
operators, including particles, a longer string of DatTable, and transformations of the xyz-axis of the
camera.
I was introduced to how I can map expressions to parameters. In this experiment, I generated tx, ty, and
tz values from my noise data and mapped them to the xyz axis of my camera, effectively controlling the
camera rotation with noise data. Following a similar process to my first experiment, I documented several
outcomes while creating the 'Tunnel' and later edited them into a video.
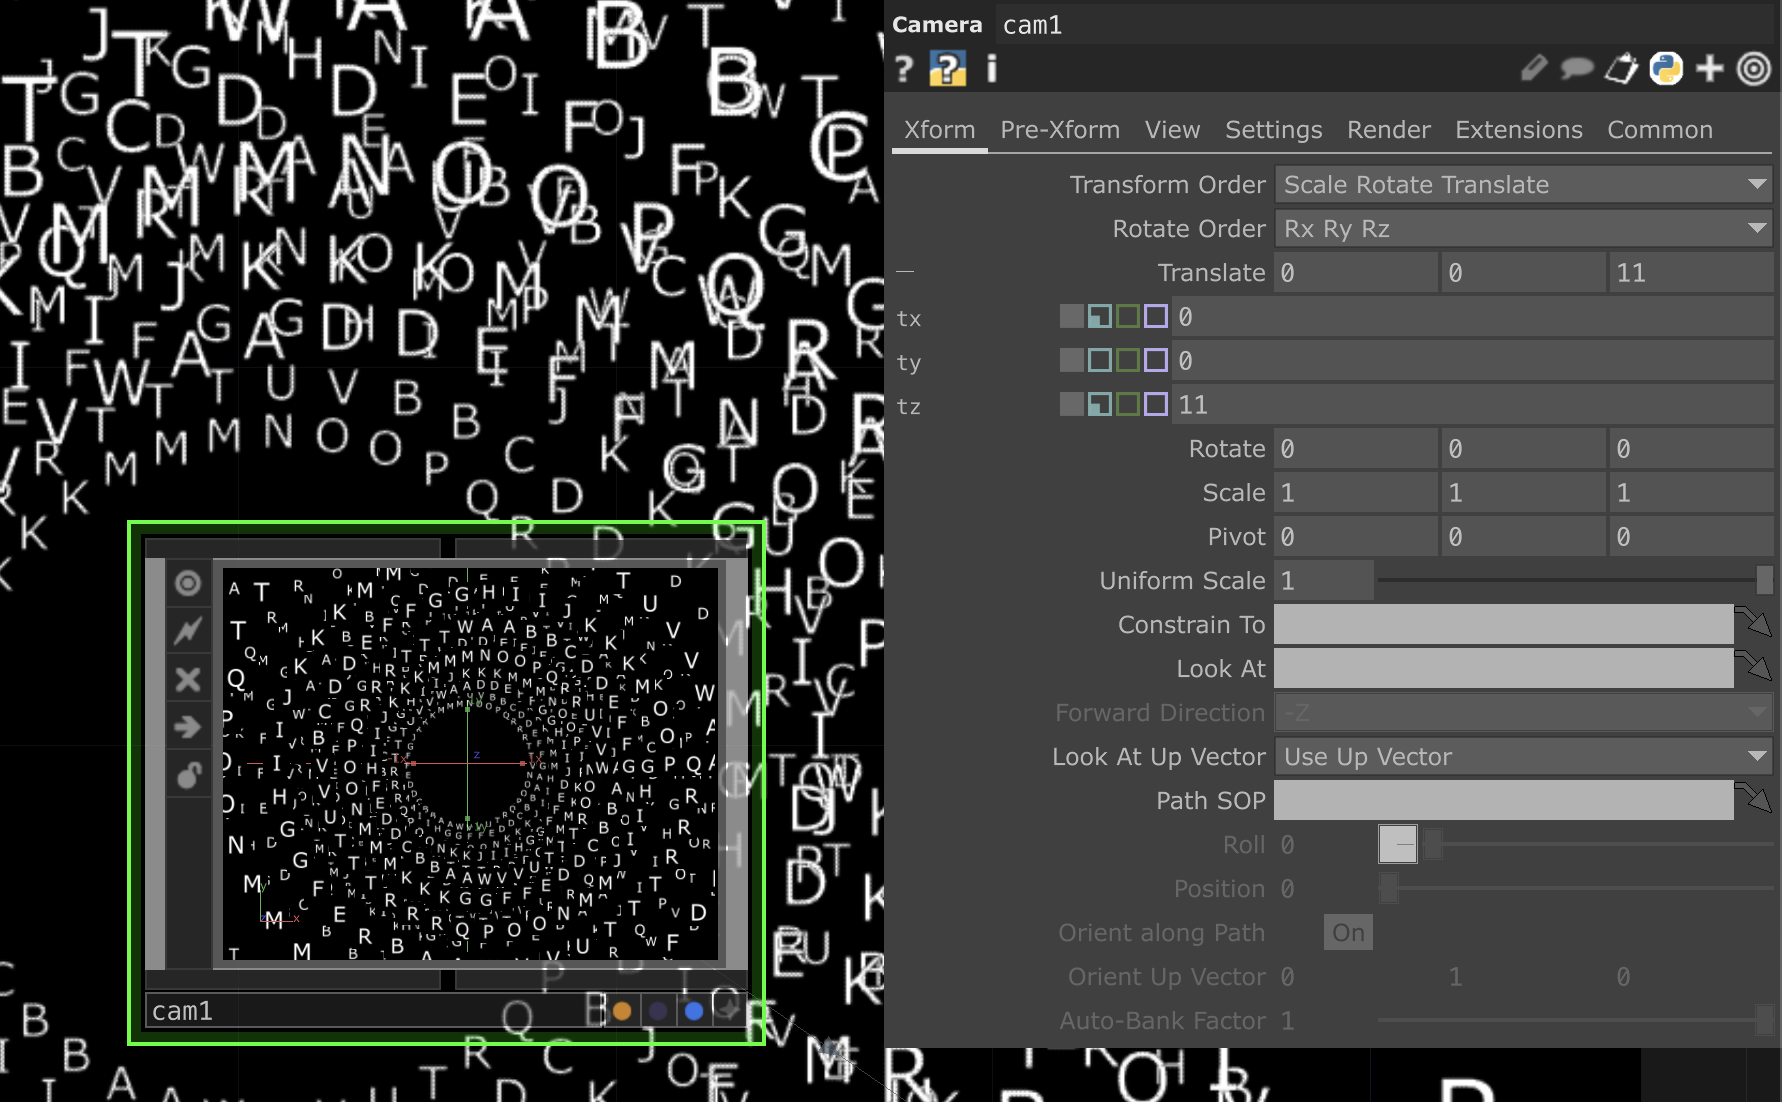
Camera rotation mapped to noise

Algorithm Literacy Visualisation
Experiment 3 – Speculative Design
I stumbled upon an intriguing visualization of a QuadTree filter on YouTube. A QuadTree is a data
structure where each internal node has precisely four sub-nodes, and it struck me as an effective way to
represent how data is processed, contextualized, and utilized in algorithmic decision-making.
Unlike previous experiments, there wasn't a step-by-step tutorial to follow this time; instead, there was
only a .toe file containing the actual filter. I dedicated some time to figuring out how to make it work,
especially since there wasn't a clear input and output operator. It turned out that this file contained
several networks, a detail I discovered thanks to my knowledge of keyboard shortcuts U and I (to jump in
and out of networks). Inside the main network, I encountered several Python extensions that were beyond my
comprehension. Rather than delving into the scripts, I opted to insert some of the operators I had used
before, eventually achieving an inverted version of the original visualization.
Pleased with the outcomes I achieved, I proceeded to search for video clips online that could effectively
convey a dystopian world. Using these clips, I constructed a speculative narrative illustrating a society
fully aware of and compliant with algorithmic data collection.
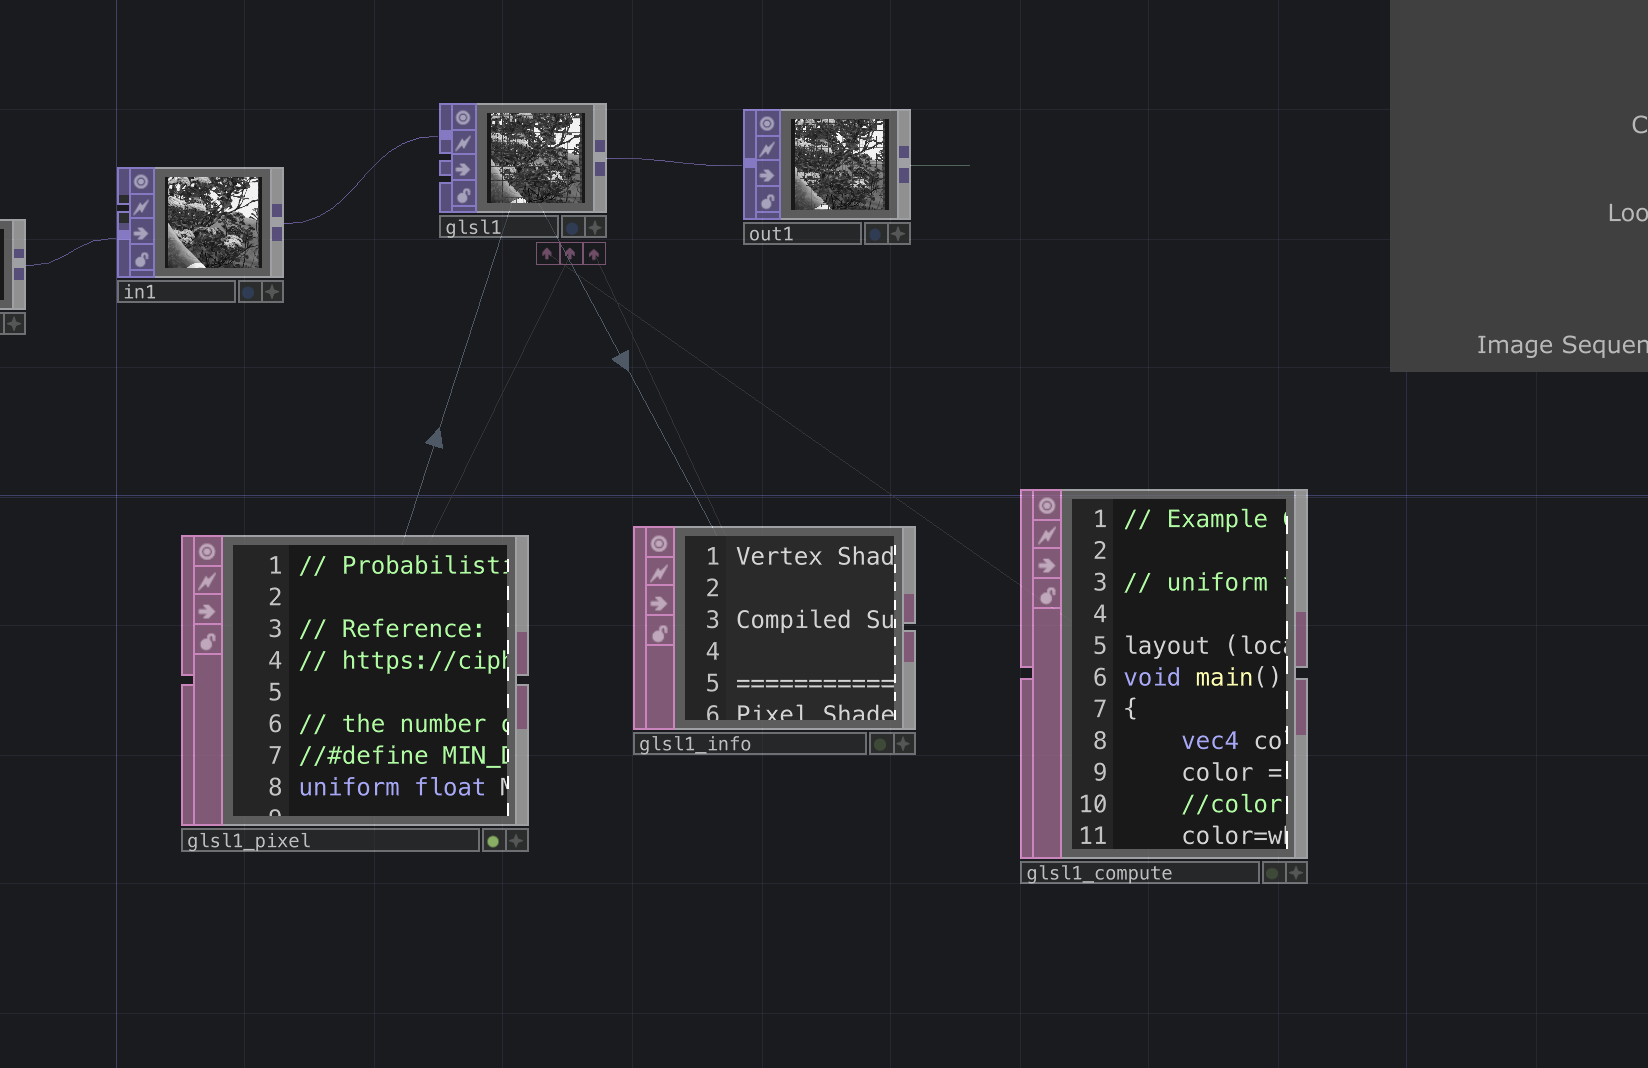
Filter run by Python extensions

Speculative Design Visualisation
Repository Curation
Extensive reading has been a crucial aspect of my research journey so far, primarily to attain a deep
understanding of my chosen research topic before I begin on the making process. It's imperative not only
for my own comprehension but also to facilitate clear communication of my research to others.
Amidst this extensive reading, I had to curate a repository of selected readings that would underpin and
substantiate my research, its processes, and methodologies. The challenge lay in balancing a comprehensive
foundation with the need to avoid overwhelming the repository with an excess of supplementary readings.
In my effort to strike this balance, I revisited my reading list to identify the key readings that had a
big influence in shaping my understanding. These selections were not merely chosen for their relevance but
also for their ability to convey my perspective and situatedness in the context of my research topic.
In order to maintain clarity and coherence in my research journey, I have consciously chosen to include
just four readings in my repository that closely resonate with my current research stage. This decision
emerged from a realization that many of the readings within my Are.na collection had started to veer away
from the core focus of my research. As my methodology and approach gradually solidify, I found that
numerous readings, although valuable in their own right, no longer align with the evolving trajectory of
my research.
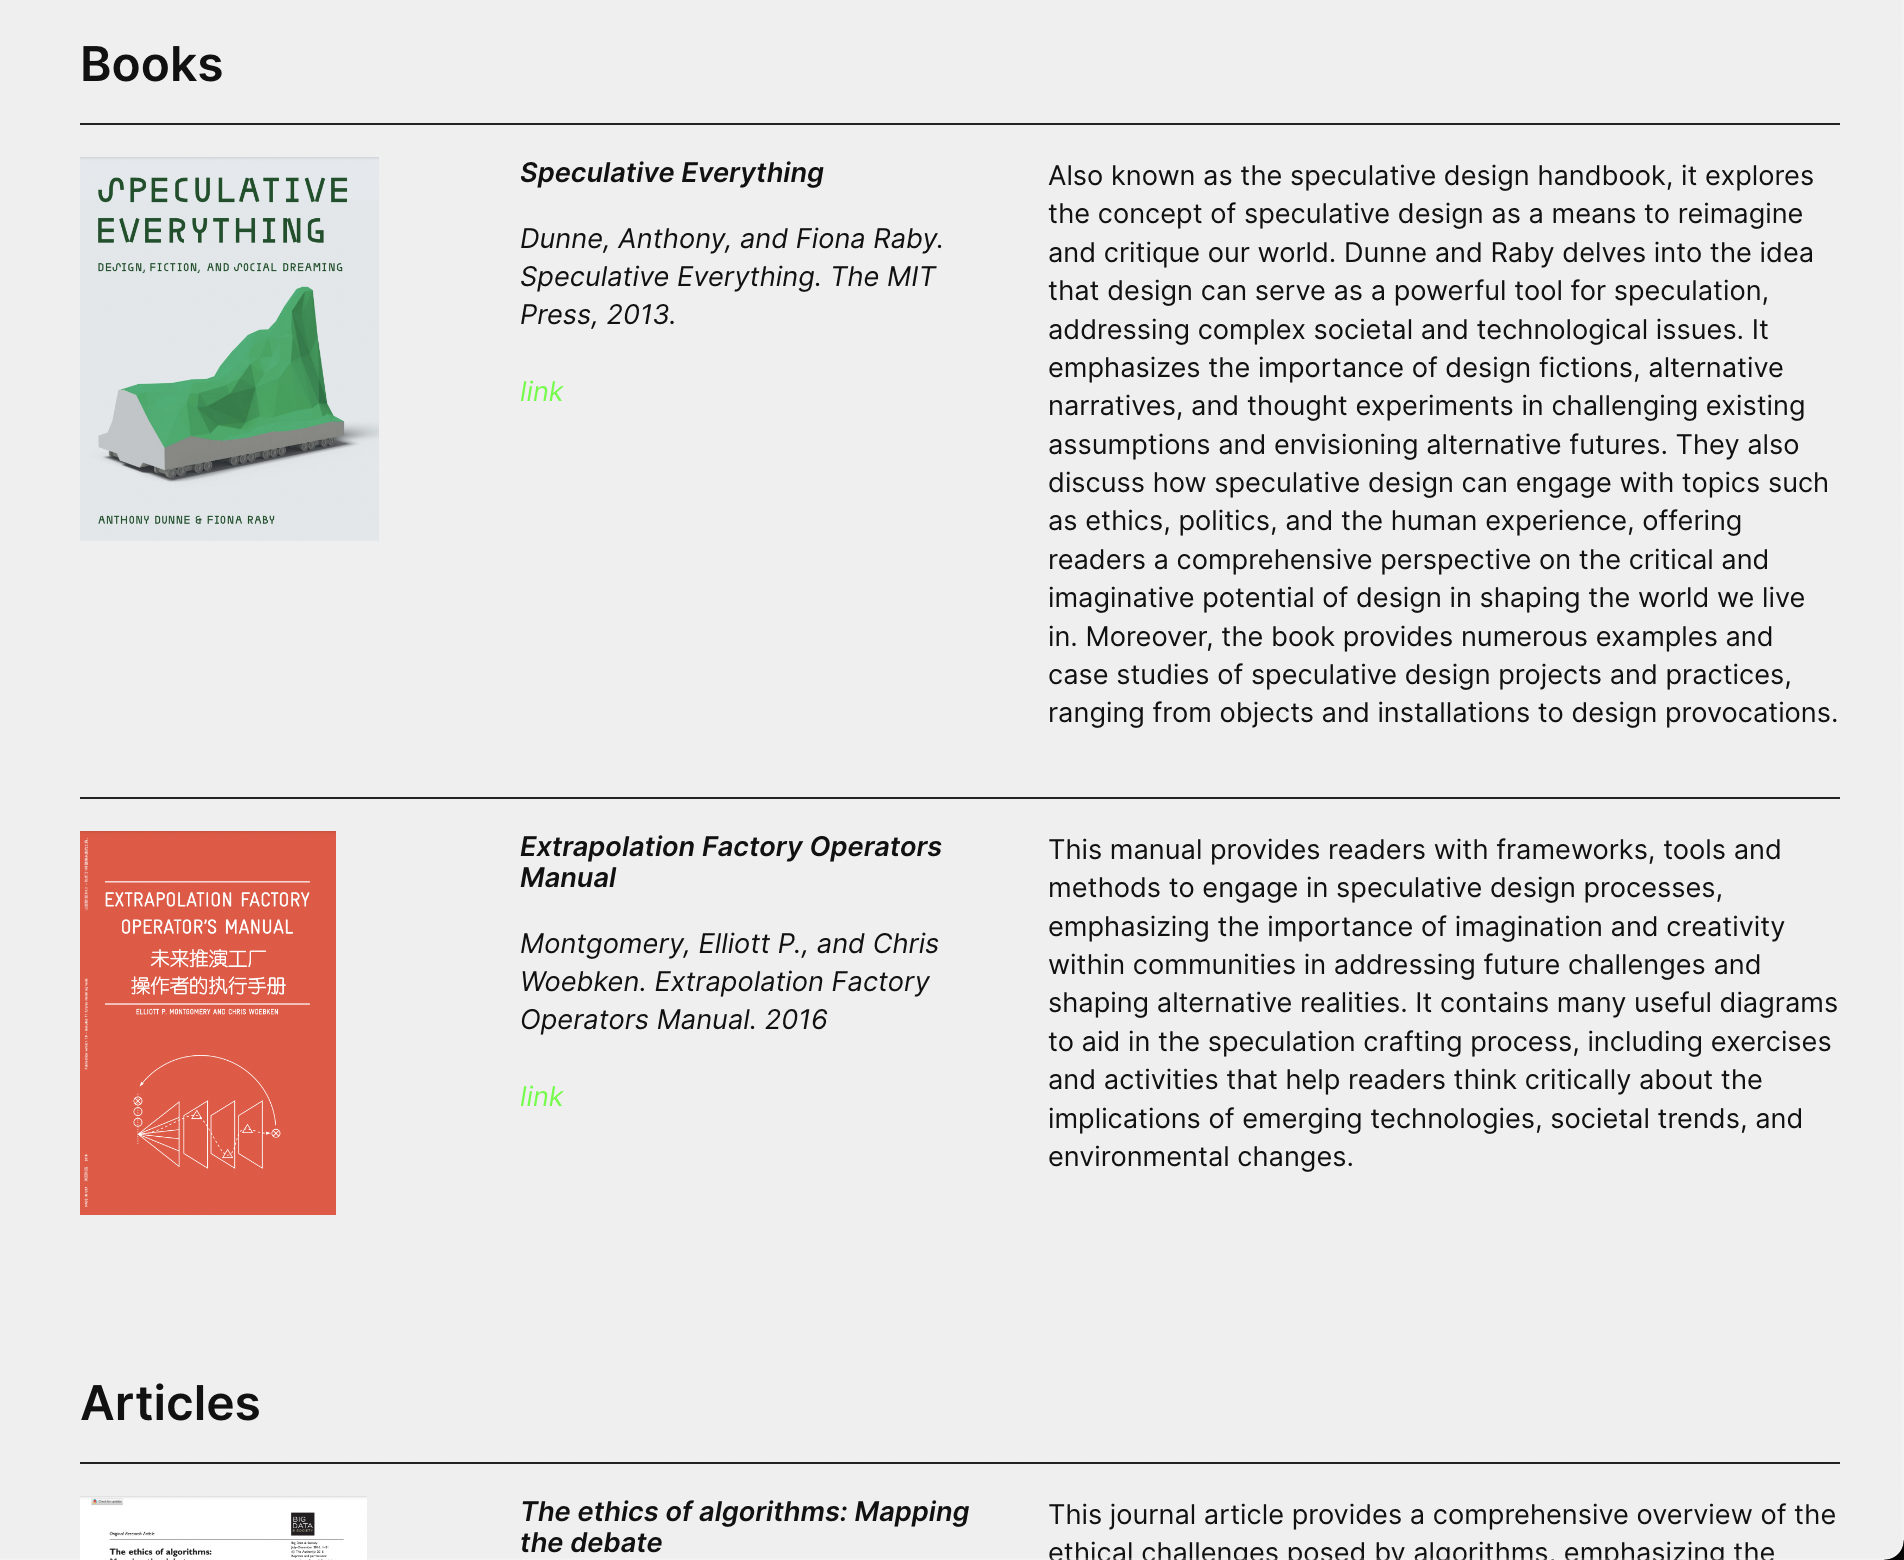
Repository Section
Catalogue of Making
For my catalog of making, I opted for a 1-page microsite. After looking at many process documentation
sites, I find this to be the most user friendly format, as it doesn’t require the user to click into pages
and it’s also generally easier to locate projects.
Instead of collaging my process and outcomes together, I separated them instead to keep the showcase area
tidy. Even though the process images were tiny, I enabled the zoom function for viewers who are interested
to view it in fullscreen. I didn’t go into too much detail about my process since it was already in my
CPJ, and let the images explain themselves. However, I did include a comprehensive write-up for each
experiment and a label indicating the software(s) used.
For the videos in my catalogue, I deliberated whether to embed them from Vimeo, considering potential
issues with file size and website loading speed. For now, I think I will just stick to local files first,
if in the future my site slows down because of file size, I’ll potentially switch over to Vimeo.
Initially, I believed that I could use Cargo for hosting, provided I had a subscription allowing me to
host my website. However, Andreas preferred a manual HTML build. Nevertheless, the work I put into the
Cargo template didn't go to waste, as it served as a reference for building my site. It wasn’t too
difficult to create my own, I just didn’t really fancy the messy system where I had a long list of code in
a html file. I know I can organise them in a .json file like the repository in the CPJ but after countless
attempts, I couldn’t really get it to work. Nevertheless, the process didn’t take too long since the
layout wasn’t too complicated and I already had an established wireframe.
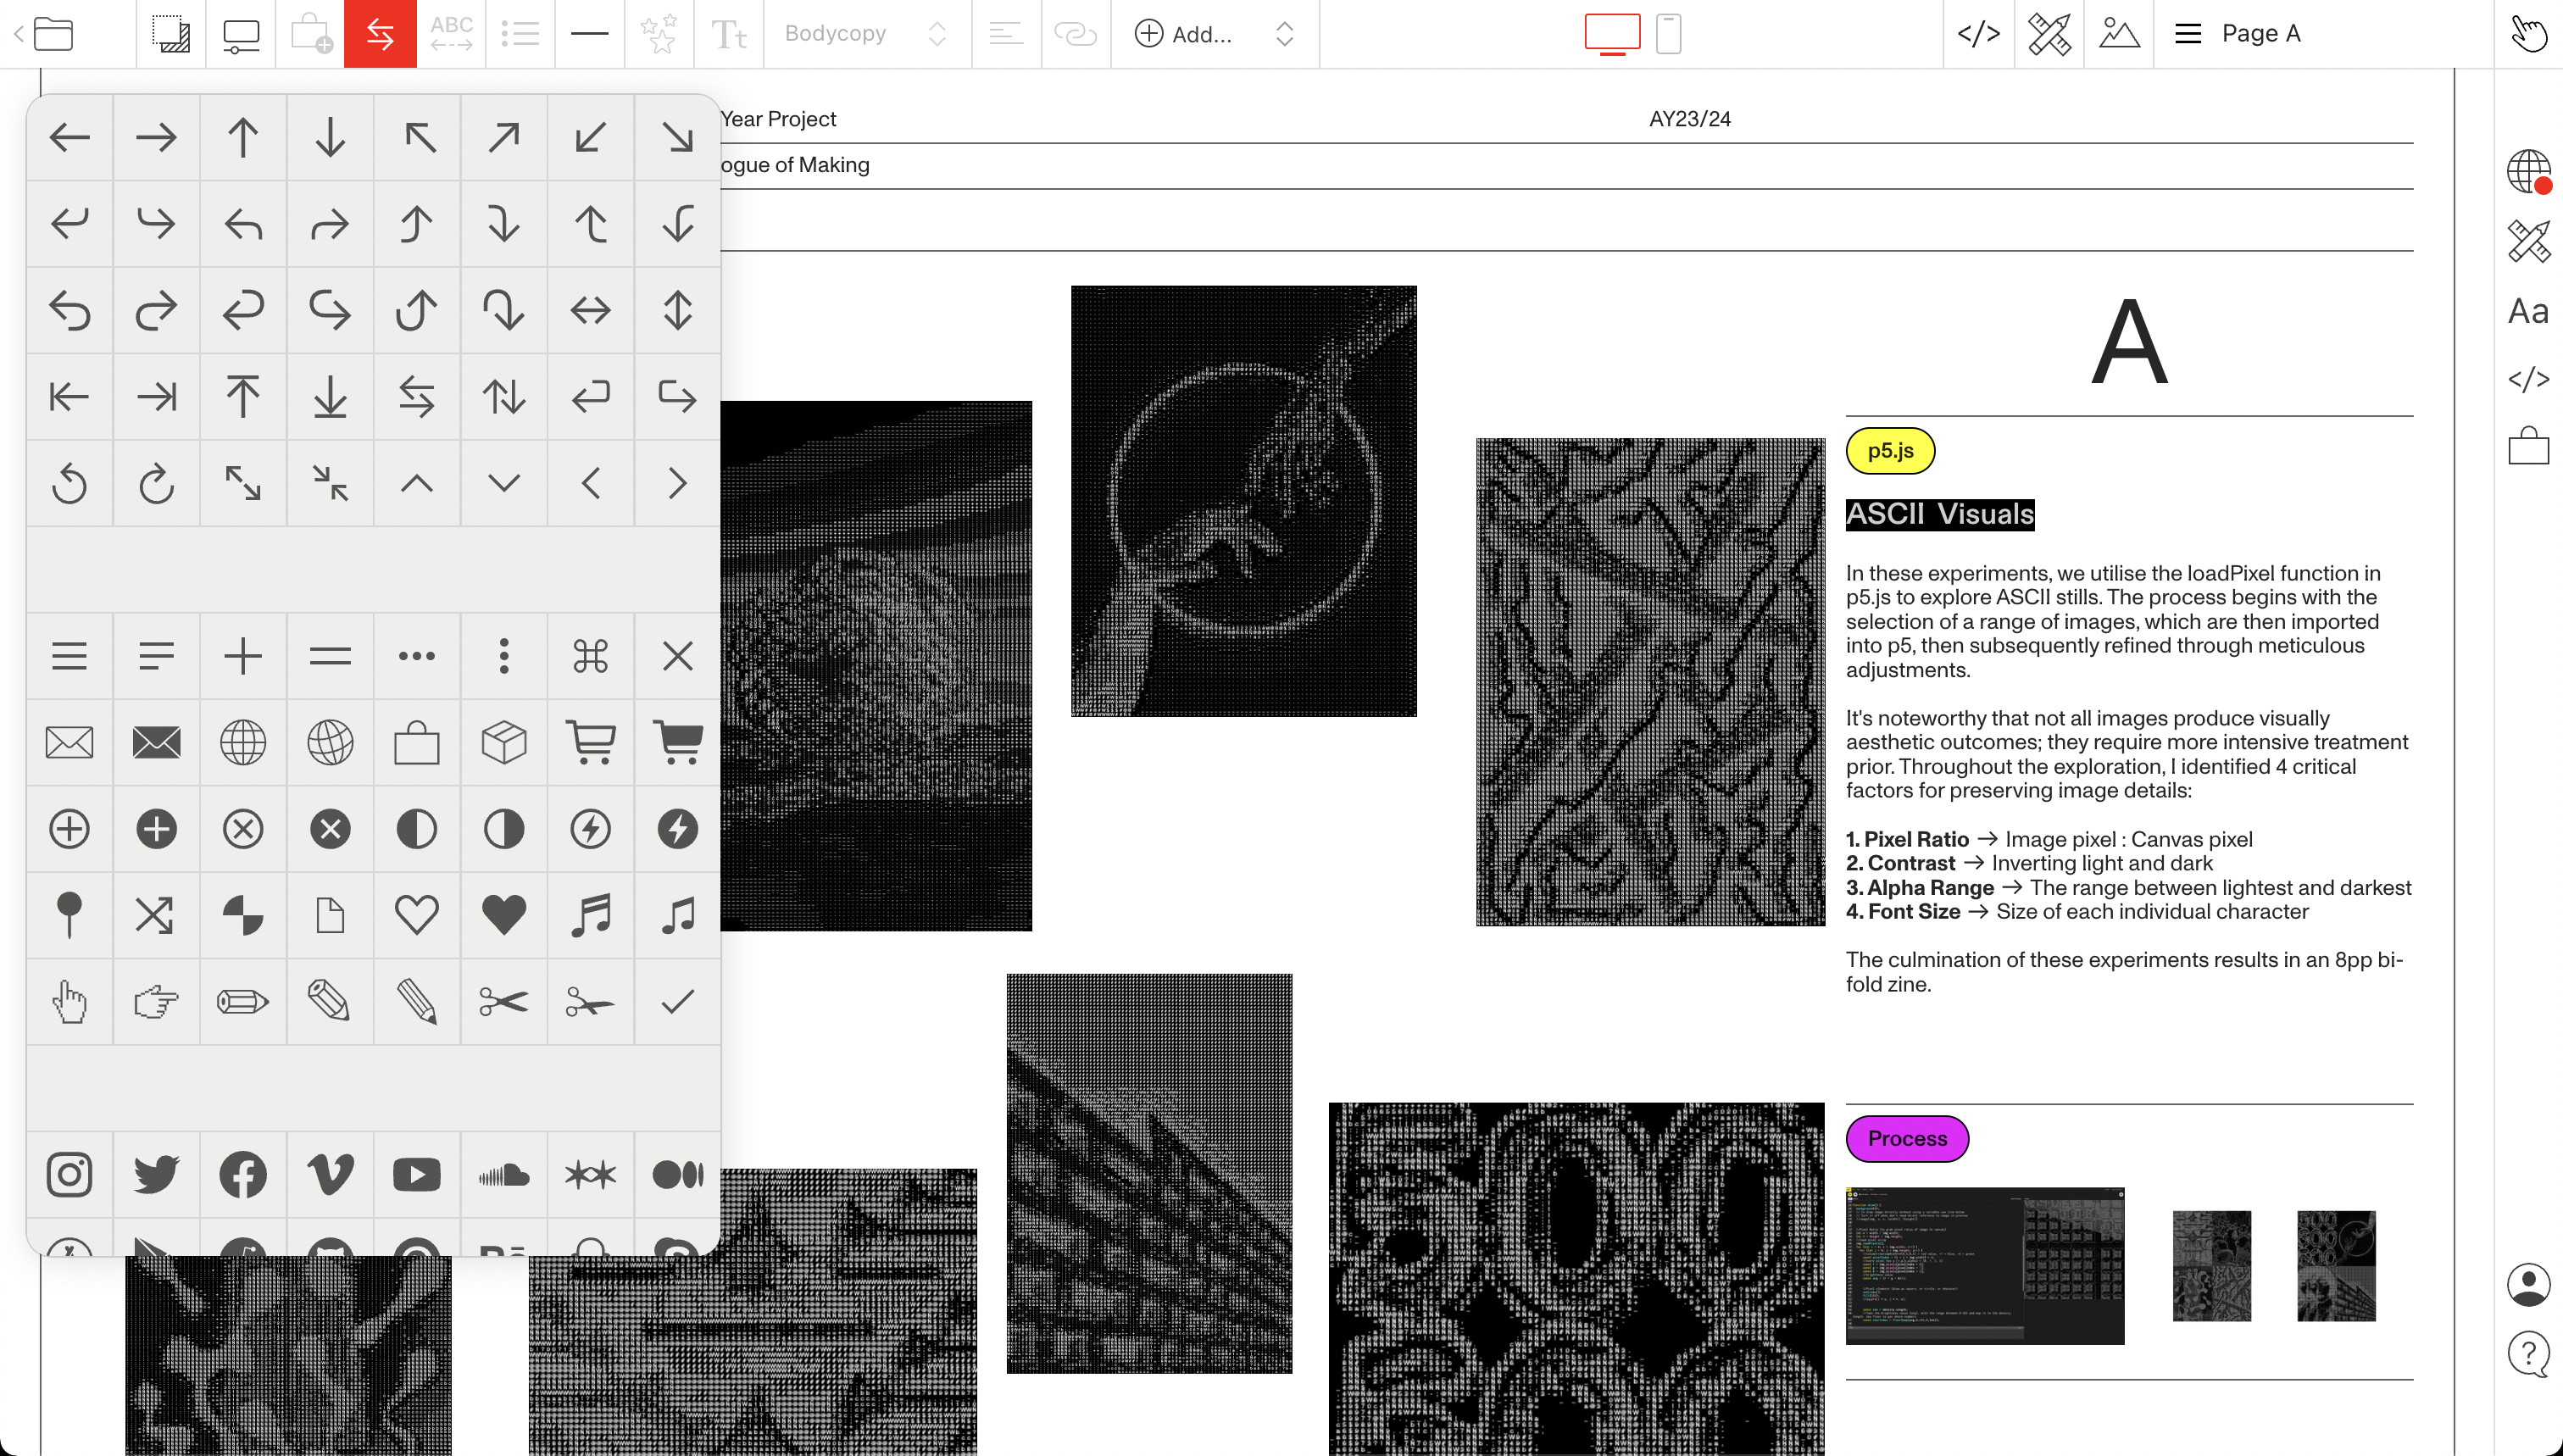
Wireframing in Cargo
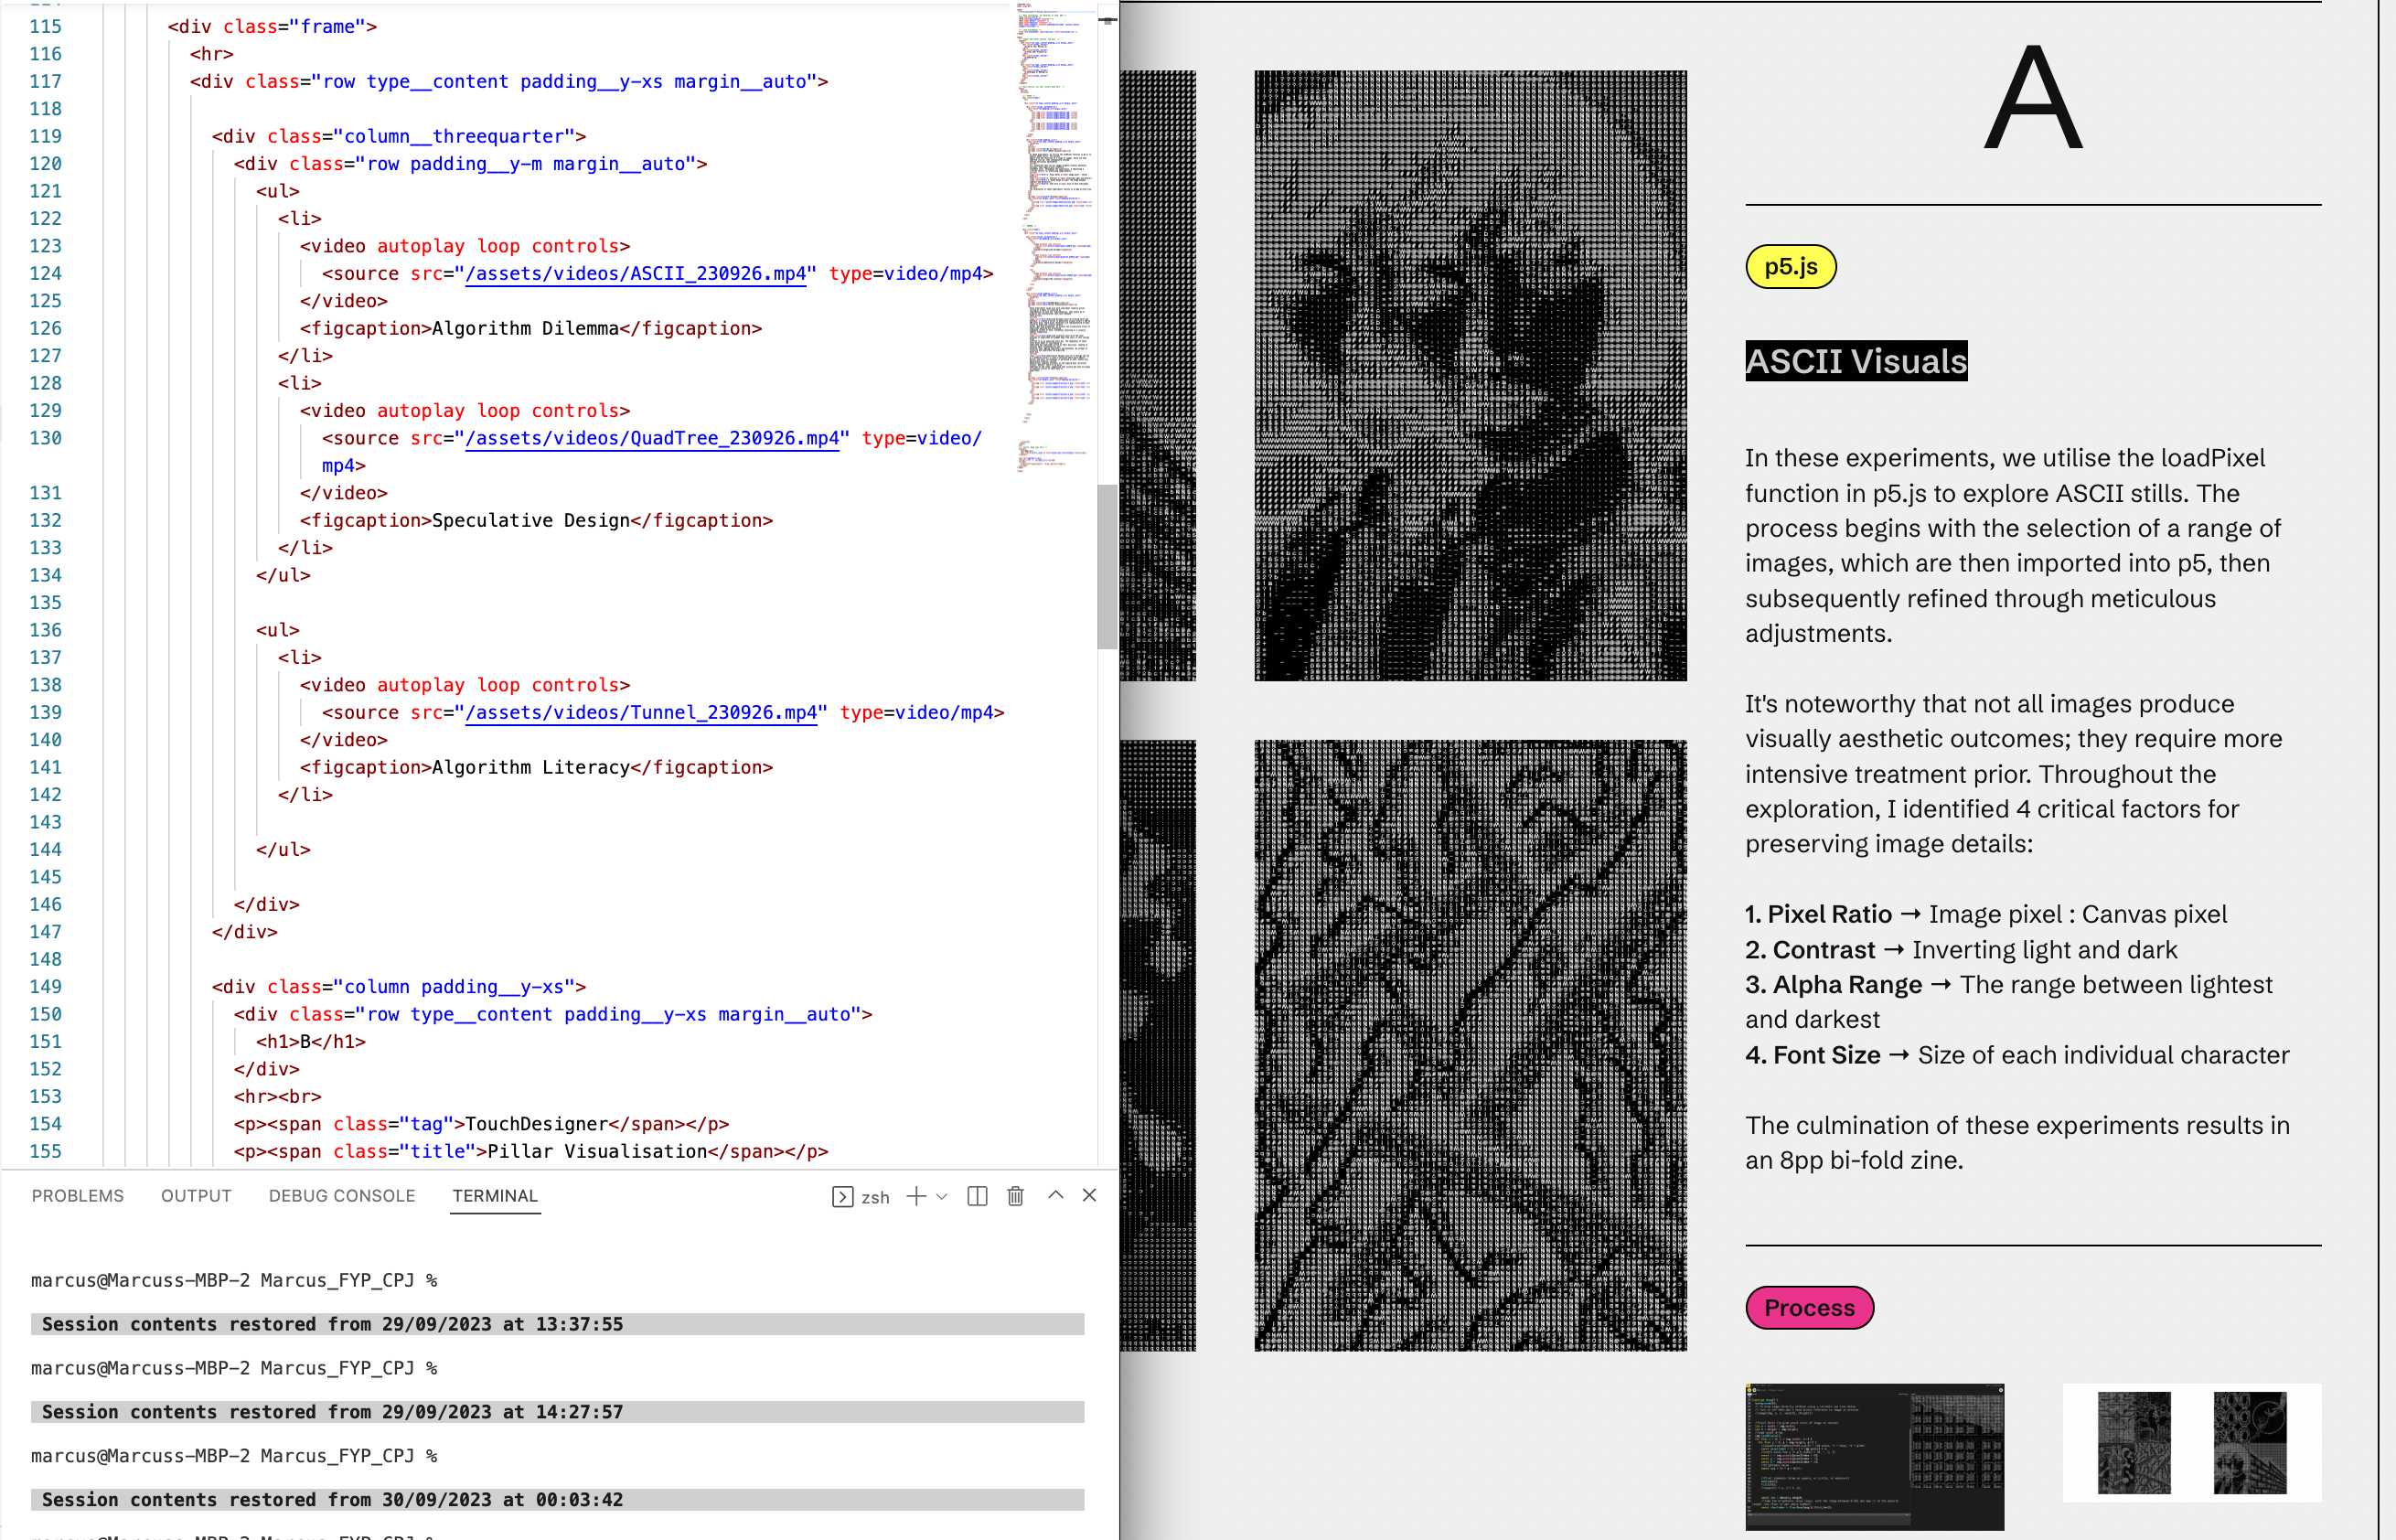
Building in HTML
Consultation
As I entered week 7, I found myself still grappling with some uncertainty about how to effectively frame
my research approach and methods. Despite my attempt to refine it, I repeatedly received feedback
suggesting that I was delving too deeply into the details. It seemed that I was struggling to strike the
right balance between adequately justifying my research and delving excessively into the step-by-step
processes.
Fortunately, Andreas stepped in, helping me to anchor the main framework of my research approach and
methods. He clarified that the critical journal would serve as my primary approach, while prototyping
would be my chosen method. With this, I gained a clearer understanding of how speculative design and RtD
(Research through Design) fit into these two central components. Having sort out my uncertainties, I now
get a clear sense of direction in how to work out this section of my RPO.